How to Apply Powerful User Engagement Metrics to Boost Your SEO

 It feels great to rank on the first page of Google for your primary keywords. You get all the love with tons of organic traffic.
Ranking on the first page is complicated, however. Brian Dean compiled a list of over 200 ranking factors that Google uses. If you’re serious about improving your search visibility, you need to find a way to attend to these factors.
I know how challenging this can be. And not everyone is ready to put in the hard work.
But what if I told you that there’s a rather easier way to rank high in the organic results pages? Would you be interested?
No, I’m not going to teach you some blackhat techniques or a secret to hacking Google’s index.
Can I be straight up with you?
From my personal experience, I observed that the most credible way to improve search performance is by focusing on user engagement metrics.
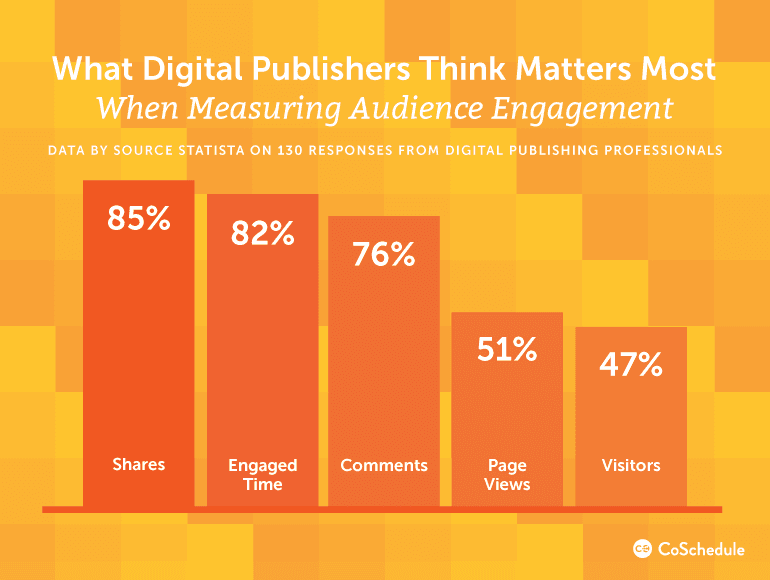
From the chart below, you’ll notice that shares, engaged time, and comments are the core metrics for measuring user engagement. Not backlinks or content length.
It feels great to rank on the first page of Google for your primary keywords. You get all the love with tons of organic traffic.
Ranking on the first page is complicated, however. Brian Dean compiled a list of over 200 ranking factors that Google uses. If you’re serious about improving your search visibility, you need to find a way to attend to these factors.
I know how challenging this can be. And not everyone is ready to put in the hard work.
But what if I told you that there’s a rather easier way to rank high in the organic results pages? Would you be interested?
No, I’m not going to teach you some blackhat techniques or a secret to hacking Google’s index.
Can I be straight up with you?
From my personal experience, I observed that the most credible way to improve search performance is by focusing on user engagement metrics.
From the chart below, you’ll notice that shares, engaged time, and comments are the core metrics for measuring user engagement. Not backlinks or content length.
 If you play your cards right, you can reverse-engineer user engagement to rank higher, with or without any so-called powerful links.
The guide below will show you how to do it.
If you play your cards right, you can reverse-engineer user engagement to rank higher, with or without any so-called powerful links.
The guide below will show you how to do it.
Download Your Free User Engagement Resource Bundle
User engagement metrics are driven by strong content. Understanding those metrics requires strong knowledge of analytics tools. To help you apply the advice in this post, we've pulled together these free resources you can use:- Five free Google Analytics Custom Reports that show when your social media and email content drive the most traffic to your site (in just a couple clicks).
- 2017 Content Calendar Template to help you schedule all your content for optimal engagement.
- Using Google Analytics to Create Smarter Content guide to help you create content readers want, based on real data.
How to Apply Powerful User Engagement Metrics to Boost Your SEO
Click To TweetWhy User Engagement Matters
User engagement is determined by observing user’s behavior. What do they do after they land on your website? Where do they click? How much time do they spend on your website? Understanding user engagement metrics helps you see what works and what doesn’t work. It helps you see what users love on your website. It’s not just about content. Design matters, too. Why? Because great design creates a great first impression and gets better marketing results. According to The Design Council, through your design, you can increase brand visibility by 200%. The same report also states that, "Shares in companies where design plays a critical role consistently outperform key stock market indicators by 200%," and that “for every $130 spent on design, businesses that are focused on design realized a $298 return.”
Recommended Reading:
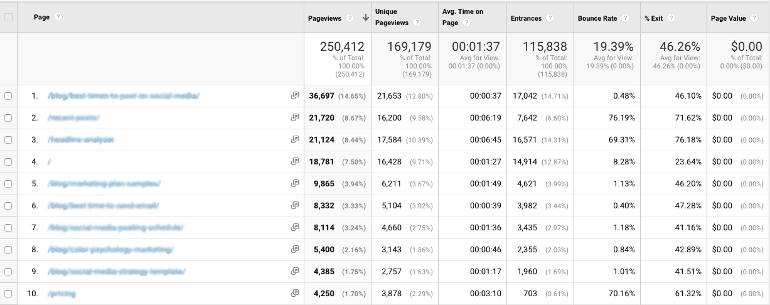
For instance, consider bounce rate. If the bounce rate of a specific blog post is higher than the rest of the posts, this means your readers don't like it as much as they do the rest of the posts.
To find the bounce rate for your posts and pages in Google Analytics, here’s that path to follow once you’re logged in:
BEHAVIOR => Site Content => All Pages
When the statistics load, you’ll see a column for the bounce rates:
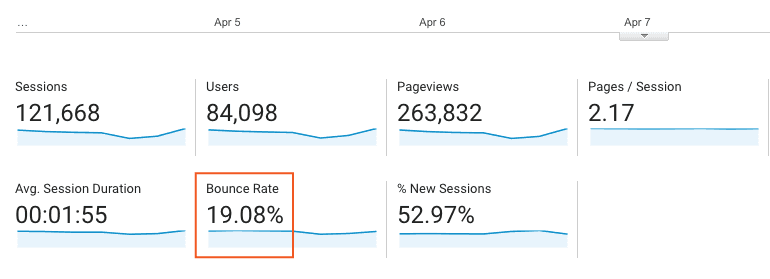
 Similarly, if a post has exceptionally low bounce rate, it could mean that your audience is in love with it. All things being equal. I’m sure you’re asking, “but, what is a good bounce rate?”
Well, the answer isn’t straightforward because we need to consider the industry, content quality, and so on. However, all hope isn’t lost yet. You can see the average bounce rate for different industries.
Similarly, if a post has exceptionally low bounce rate, it could mean that your audience is in love with it. All things being equal. I’m sure you’re asking, “but, what is a good bounce rate?”
Well, the answer isn’t straightforward because we need to consider the industry, content quality, and so on. However, all hope isn’t lost yet. You can see the average bounce rate for different industries.
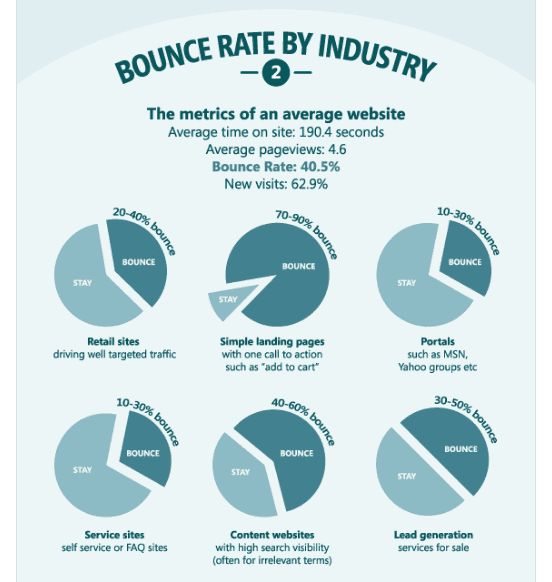 Additionally, GoRocketFuel conducted an exclusive study to determine what a good bounce rate is. According to their findings:
“Most websites will see bounce rates fall somewhere between 26% and 70%. The average bounce rate for the websites in my sample set was 49%. The average bounce rate for all visits in the set was 45%. I threw out the outliers—the 1% bounce rates. The highest bounce rate was 90.2%; the low (from a properly functioning profile) was 27.33%. The low across all (including broken implementations) was 1.23%.”
 So when you find blog posts with a good bounce rate, replicate.
Create similar posts that your readers will love again.
Your chances of ranking higher in Google top pages are high, because Google appreciates a web page with a low bounce rate.
So when you find blog posts with a good bounce rate, replicate.
Create similar posts that your readers will love again.
Your chances of ranking higher in Google top pages are high, because Google appreciates a web page with a low bounce rate.
Determine What Users Are Doing On-site
It’s high time you get to know what users are doing on your website. Neil Patel identified five engagement factors that will affect influence your search engine rankings. These include:- Traffic. This includes visitors from organic sources.
- Pageviews and bounce rate.
- Brand mentions.
- Mobile-responsive design.
- Technical SEO (structured for users).
- Clicks on internal and external links.
- Social shares.
- Scroll depth.
- Form submissions.
Are you paying attention to these important user engagement signals?
Click To Tweet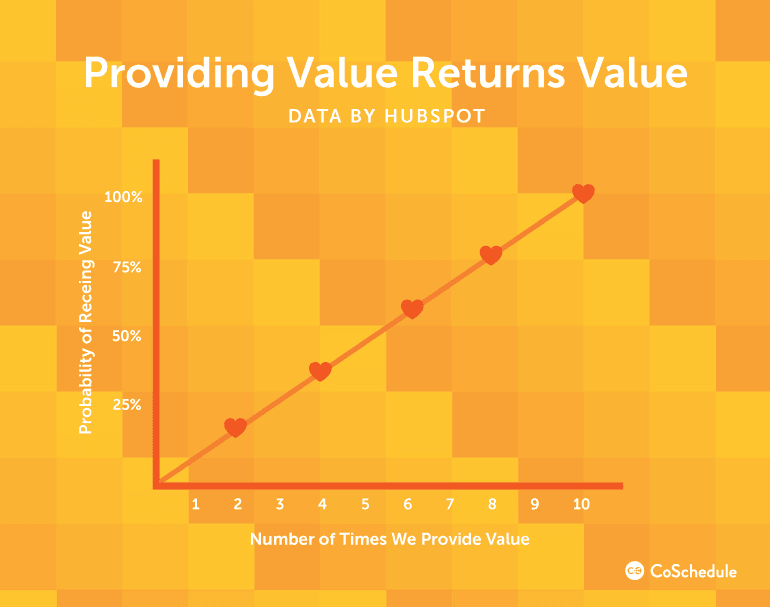 Source: HubSpot
Good #SEO boils down to one simple practice: providing value.
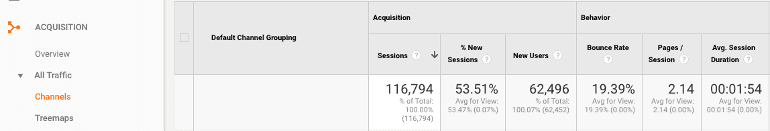
Click To Tweet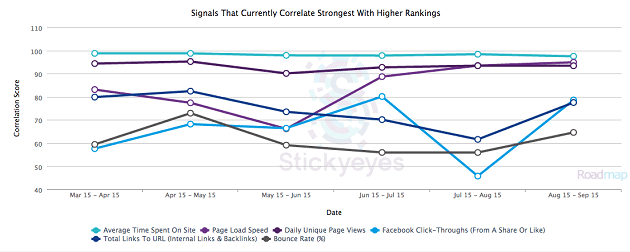 These user engagement metrics can be accessed from Google Analytics. This will help you identify the best performing landing pages on your website.
These engagement metrics are the results of user’s behavior while on your website.
To see these metrics in your Google Analytics account go to:
These user engagement metrics can be accessed from Google Analytics. This will help you identify the best performing landing pages on your website.
These engagement metrics are the results of user’s behavior while on your website.
To see these metrics in your Google Analytics account go to:
Acquisition -> All Traffic -> Channels
 When you’ve identified your best performing landing pages, you need to install a heat map script so that you can study the user behavior properly.
To find your best performing landing pages, follow this path in Google Analytics:
When you’ve identified your best performing landing pages, you need to install a heat map script so that you can study the user behavior properly.
To find your best performing landing pages, follow this path in Google Analytics:
Behavior => Site Content => Landing Pages
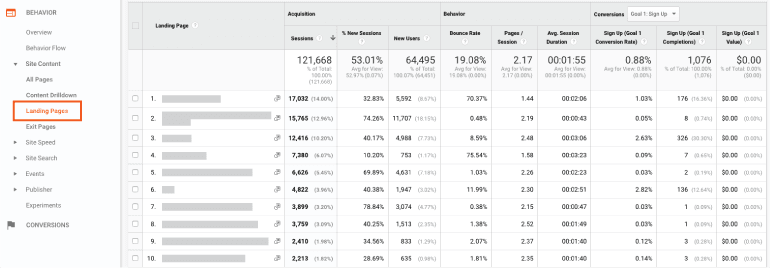
Here's how to find your best-performing landing pages using Google Analytics:
Click To TweetUse Heatmaps to Understand Vantage Positioning
A heat map tool like Crazy Egg can show you the exact sections of your website that users are clicking and why? It uses mouse-tracking to determine scroll and clicks. To fully understand what users do on your website, where they click, how deep they scroll, and what they don’t like, you have to use heatmaps—it gives you better insights about users.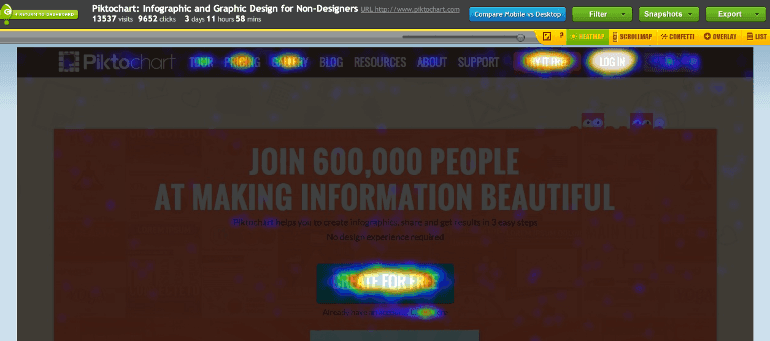 Source: Piktochart
For instance, you saw five pages in Google Analytics with below average bounce rates. At that point, you should ask yourself, “why do people like these pages more than other pages on the same website?”
Do they like the video? Or the infographic? Or the GIFs or something else?
This is where a heat map tool gets the job done.
You can determine the following using a heat map:
Source: Piktochart
For instance, you saw five pages in Google Analytics with below average bounce rates. At that point, you should ask yourself, “why do people like these pages more than other pages on the same website?”
Do they like the video? Or the infographic? Or the GIFs or something else?
This is where a heat map tool gets the job done.
You can determine the following using a heat map:
- How users move their mouse on any given page. Do they move their mouse on the title and images?
- A click map shows where users click on the page. Are they clicking the new video that you just created?
- Scroll maps show how deep users scroll. It’s one of the best user engagement metrics that show the point users exit the page. This makes it easier to adjust the length of your page.
 Now, see what their heatmap revealed:
 The navigation bar at the top left was getting more clicks than the conversion button. It was a distraction.
Though they were getting a decent traffic on the homepage, pageviews were counting, and everything was working fine. But they weren’t getting as many downloads as expected.
So, Lim removed the navigation bar and conversion rate quickly increased by 12%. He also removed the ‘download for free’ text above the button and it increased conversion rate by an additional 10%.
The navigation bar at the top left was getting more clicks than the conversion button. It was a distraction.
Though they were getting a decent traffic on the homepage, pageviews were counting, and everything was working fine. But they weren’t getting as many downloads as expected.
So, Lim removed the navigation bar and conversion rate quickly increased by 12%. He also removed the ‘download for free’ text above the button and it increased conversion rate by an additional 10%.

Create More Interactive Content
If you want to increase user’s time on your website, you need to add more interaction to your content. You could add interactive infographics to your post, or embed quizzes. However, there are two forms of interactive content that truly boost engagement. These include: a). Calculators: Integrating a simple calculator into your written content can improve your content’s perceived value and take your engagement to the roof. For example, SilkRoad, a HR software for Talent Management created a calculator to show prospective clients they could become more productive and save with its employee onboarding automation solution. Within 3 months, the company saw an increase in lead generation and content engagement. You'll need to work with your development team to make something like this happen. However, the results are worth it.
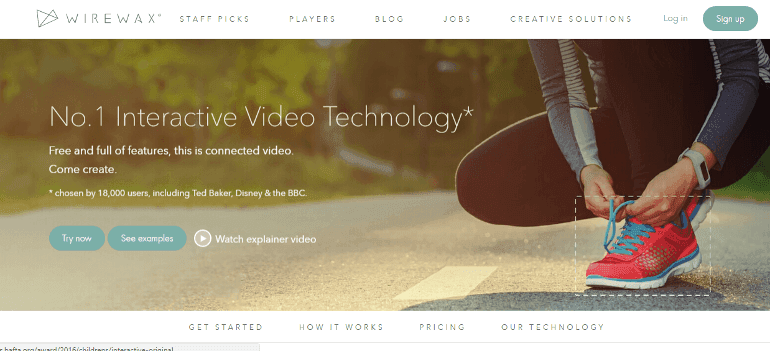
b). Interactive video: Video marketing still works. Data from Convince and Convert shows that audiences are 10x more likely to engage with video content.
Sadly, they’re still a static medium, which means that you have a lot of opportunities right now to make your videos interactive. But how?
In an interactive video, you’re giving viewers the opportunity to participate in your video as opposed to just viewing it. You could add interactive hotspots so that a viewer can click to learn more about the person, an event, or a topic.
Some of the handy tools that you can use to create interactive videos are:
You'll need to work with your development team to make something like this happen. However, the results are worth it.
b). Interactive video: Video marketing still works. Data from Convince and Convert shows that audiences are 10x more likely to engage with video content.
Sadly, they’re still a static medium, which means that you have a lot of opportunities right now to make your videos interactive. But how?
In an interactive video, you’re giving viewers the opportunity to participate in your video as opposed to just viewing it. You could add interactive hotspots so that a viewer can click to learn more about the person, an event, or a topic.
Some of the handy tools that you can use to create interactive videos are:
 Truth is, interactive videos can quickly improve your audience’s perception of your brand.
Interactive videos can quickly improve your audience’s perception of your brand.
Click To Tweet“One of the best examples of interactive video I've seen is the Guardian's "Seven Digital Deadly Sins." In it, viewers can explore the stories of seven users of digital media and how it affects their lives. A 'burger menu' to the side adds to the user interface, and there are several "easter eggs" in the form of one-question surveys that show real-time stats.”Here's a quick look at it:

Recommended Reading:
When you’re looking to create more engagement on your page, adding more interactivity can help. But again, it comes after studying your users closely using tools.
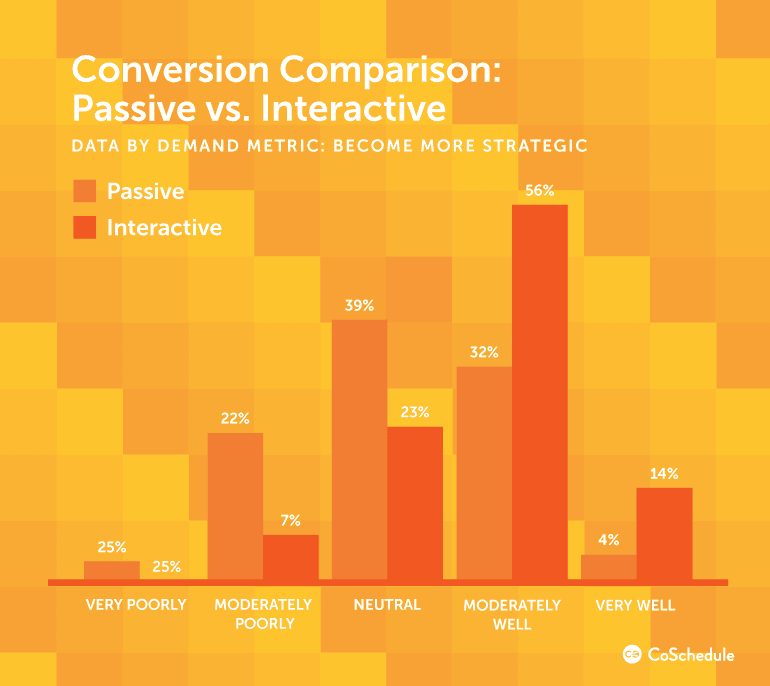
Statistics show that interactive content converts better than passive content. In the study, interactive content converted more than 70% of buyers while the passive content only converted 36% of buyers.
 Two of the reasons why most people don’t build interaction into their content is because they don’t know what type of interactive content to create that users will love.
This challenge can be solved using Google Analytics and heatmaps.
Two of the reasons why most people don’t build interaction into their content is because they don’t know what type of interactive content to create that users will love.
This challenge can be solved using Google Analytics and heatmaps.
What #interactive #content will your audience love? Find out with Google Analytics and @CrazyEgg:
Click To Tweet- Qzzr: A simple tool for creating online quizzes for free.
- SnapApp: It’s a powerful content platform which allows you to turn static content (e.g., PDF document) into an interactive slide presentation).
- Mapme: Build interactive maps with videos, words, and photos.
- Infogram: Use this tool to create interactive infographics and charts.
Recommended Reading: How to Make an Infographic in 7 Easy Steps
Craft Beneficial Headlines, Not Clickbait
You can use user engagement metrics and insights from Google Analytics and heatmaps to write better headlines. Here’s how. Let’s assume that one of your best performing landing pages has this headline:- 12 Smart Ways To Launch a Successful Online Course
- 11 Product Launch Tools That I Use Every Time
- 7 Steps To Hack a Winning Product Idea
- 3 Must-Have Pricing Strategies You Should Adopt
- Make them benefit-driven. Clearly state the benefit that the readers will get from the content. Here are some examples of such headlines:
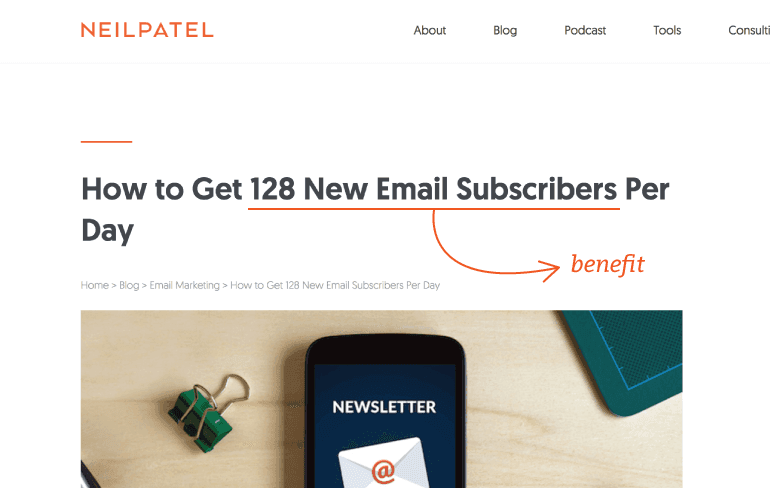
- Keep headlines descriptive. Inappropriate, ambiguous, and unclear headlines might send untargeted traffic to your page.
- Use A/B test to prove your best headlines.
- Optimize headlines. Include a keyword in the headline that will help you drive traffic from search engines.
Bonus Tip: Use CoSchedule's Headline Analyzer Studio to make sure every headline you write is a winner.
A killer headline combined with the content that your users and search engines have shown great interest in initially will rank exceptionally well in search engines.
A killer headline + content your users want = search rankings.
Click To TweetHow Will You Use User Engagement Metrics to Create Better Content?
Focusing on your users and what interests them is truly the best way to create content that ranks highly in Google organic pages. It may seem like a lot of work, and it’s true, but if you dare to listen to your audience more it becomes a lot easier to answer their questions.If you dare to listen to your audience, it becomes a lot easier to answer their questions.
Click To Tweet