How To Make An Infographic In 7 Easy Steps

 Infographics are 30 times more likely to be read than a purely textual article. Love them or hate them, they are a rising content type for reaching your audience. Infographics are also the highest shared content type and therefore, one of the best and quickest ways to communicate data to your audience. As a designer who loves numbers, I personally fall into the ‘love’ category with infographics, but I realize that not everyone has been taught how to make this popular content type.
While infographics are easy to digest, they’re not necessarily easy to create, so I hope to enlighten you in how to make an infographic in 7 easy steps from research all the way to publishing.
Alright, let's do this!
Infographics are 30 times more likely to be read than a purely textual article. Love them or hate them, they are a rising content type for reaching your audience. Infographics are also the highest shared content type and therefore, one of the best and quickest ways to communicate data to your audience. As a designer who loves numbers, I personally fall into the ‘love’ category with infographics, but I realize that not everyone has been taught how to make this popular content type.
While infographics are easy to digest, they’re not necessarily easy to create, so I hope to enlighten you in how to make an infographic in 7 easy steps from research all the way to publishing.
Alright, let's do this!
#Infographics are 30 times more likely to be read than a purely textual article. via @ashtonwirrenga
Click To Tweet1. Find A Topic
Before beginning any project, we must begin with two questions: ‘What?' and ‘Why?' We should know exactly what the goal of each project is, and exactly why it’s important. If you skip these two questions, two outcomes are bound to happen. Either you'll start working and get lost somewhere in the middle of the project, or you’ll create something awesome that has no purpose, which is quite sad. Personally, I’d rather make something awesome AND have it reach a goal. Then it's a win-win for everyone! In order to do that, every great infographic must begin with a good topic. Ask Yourself:- What are people asking about?
- What problem does my audience have?
- What current ideas could be better explored and communicated?
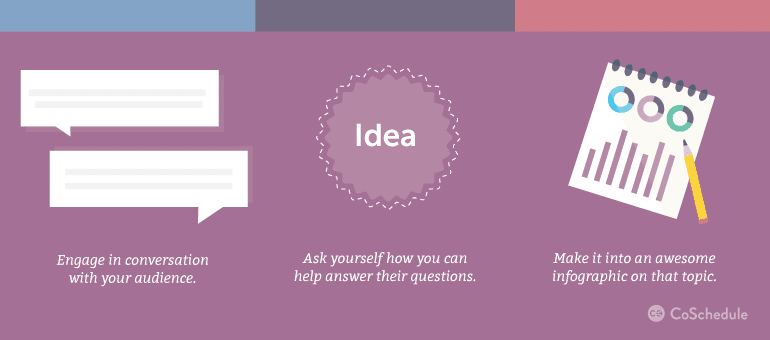
Pro Tip: Create a survey or engage with your audience on social media to see what problems you could solve with your infographic.
2. Do Your Research
Now that you have a stellar topic, it’s time to do research. This step might take some time, but it’s absolutely critical so embrace it and dig in. Find absolutely everything you can around that concept by beginning with the large resources, and then move onto the small bits and pieces that may be hiding. Again, don't be scared to invest significant time into this stage. Research is the very core of an infographic, so it's worth it in the long run.Research is the very core of an #infographic, so it's worth it in the long run. #contentmarketing
Click To TweetGet Perspective
Search for similar counterparts and find out why your topic is essential to what you’re trying to prove. Then, explore the ideas that completely oppose it. This will give you a wholesome perspective, and might even surprise or counter your initial idea. Let the data shape your topic and adjust when necessary. Remember, infographics are first and foremost research; however, boring data designed nicely will still end up as a boring infographic. While it might seem tedious, take the time to find interesting data so you can set yourself up for one heck of an infographic.#Creativity is just connecting things. —Steve Jobs
Click To TweetLook For Numbers
Statistics and numbers do exceptionally well on infographics because they're easy to digest, and they hold a ton of value. They’re both fascinating and can be represented in a hundred different visual formats. It’s a win-win for you and your audience!Pro Tip: Does one of your blog posts already have a ton of numbers and statistics in it? Consider making an infographic out of it!
Find A Story
With all the research and numbers floating around, it's easy for an infographic to lack a sense of story. Bring it to life by thinking of the big picture, and choose a theme or metaphor that can be consistent throughout all the data. This way your infographic will read like a book from beginning to end, giving your audience a sense of excitement and curiosity as they read.Pro Tip: What emotional quality does your research represent? Use that same emotion to think of a story you'd like to refer to in your infographic.
3. Gather Visual Inspiration
Just when you thought you were done with research.... say hello to visual inspiration! Now that you have all your numbers and stats, its time to clear your head and gather visual ideas for your infographic. Some of my favorite places to begin my search for visual inspiration can be found at Behance, Pinterest, and Dribbble.
Take a break, switch your perspective, and let's talk visuals.
Ask Yourself:
Now that you have all your numbers and stats, its time to clear your head and gather visual ideas for your infographic. Some of my favorite places to begin my search for visual inspiration can be found at Behance, Pinterest, and Dribbble.
Take a break, switch your perspective, and let's talk visuals.
Ask Yourself:
- What chart formats are currently working really well?
- How are others telling the story?
- What styles are you drawn to?
- What infographics do your readers enjoy?
- Why was it successful?
- How can it be improved visually?
Pro Tip: Don't undervalue the value in asking these questions. They very well may save you hours once you start designing your infographic.
4. Design Your Infographic
You’ve come prepared with an awesome topic that your audience loves, you have data to back it up from credible sources, and your creativity is ready to explode from all the visual inspiration. Now, it’s time to design! Here are your options...
Option 1: Outsource It
Outsourcing can be a great option if you don’t have design experience or the time to create an infographic. And good news! There are several designers out there who are waiting to work with you. You're probably wondering, how it works?- Contest Outsourcing: Companies like 99designs allow you to create a contest centered around your design needs. In this case, you choose your dollar amount, enter the design details of your infographic, and then wait to see what designers submit in hopes of finding the best one for you. Several concepts are submitted, so there’s typically a good amount to choose from, and it's always quite fast.
- Freelance Outsourcing: Another option is to find a freelance designer through sites like Dribbble or Behance. This will give you direct access to the designer so a relationship can be built. You'll also have the space for any revisions that might need to take place. Freelancers either get paid hourly or project by project, and so it's important to ask that right away when selecting your designer.
Recommended Reading: How To Work With Designers With Authentic Advice From CoSchedule's Designer
Option 2: Create It Yourself
You’re awesome! Way to take your infographic idea head on. Whether you have design experience or are just beginning, here are some helpful tips to get you started:- Free tools: There are several amazing infographic tools out there that let you easily start the design process. Visage, Vizualize, Easel.ly, Piktochart, Infogram, Visual.ly, Venngage, Visme.co, and Canva just to name a few. There’s also several video tutorials if you have a specific program you’d like to work in.
- Choose A Color Scheme: Ask yourself what mood will show off your topic best, and then find some different color palettes that display the same mood. I love using Adobe Kuler for this. You can easily take visual inspiration and play around with the different colors to find something that fits exactly what you’re going for. Typically, there are three main colors throughout, and then two accent colors, making a five color scheme ideal for both vibrancy and consistency in your infographic.
- Select Key Points To Highlight: Just as in a story, there are certain pieces of information that are more important than others. With design, it's the same way; they call this visual hierarchy. To utilize hierarchy in infographics, I try to find the three core subtopics and then distinguish each section slightly differently throughout the infographic. Once I have three key sections, I begin by adding the smaller details. What is each section’s title? What data belongs in each section? What captions can be added to explain the data? Start big and work your way down to the smaller elements.
5. Review For Consistency
Way to go, you've come so far! Once you have your infographic initially laid out and designed, take a step back and get some feedback. Don’t be afraid to ask your peers or friends for honest, constructive feedback so you can refine the design to perfection before hitting publish. Ask:- Is anything standing out too much?
- Is there any information that’s not obvious enough?
- Does the story flow smoothly from beginning to end?
Pro Tip: Print out your infographic at full size and stand 10 feet away from it. What do you see? This will allow you to review your infographic from a macro-level, and give you a new perspective on the piece as a whole.
6. Add A Call To Action And Credits
This is your final step. Your infographic is beautiful and filled with awesome data, so now it's time to add that very essential call to action that will guide readers into doing what they should do next. Should they sign up for something? Or recommend it to a friend? What one thing do you want your audience to do?Pro Tip: The call to action should directly point to the overall goal of the infographic that you've been working around.
 Give credit. Unless you did a ton of surveys and researching from the ground up, you probably have several sources that deserve credit in your infographic. These will show that your information is not only thought out but also credible. The credits also serve as a way for the readers to find out more information if they choose to.
Remember, add the call to action, the credits, and then you’re all set!
Give credit. Unless you did a ton of surveys and researching from the ground up, you probably have several sources that deserve credit in your infographic. These will show that your information is not only thought out but also credible. The credits also serve as a way for the readers to find out more information if they choose to.
Remember, add the call to action, the credits, and then you’re all set!
7. Publish And Share
Time to promote! This is where infographics become very handy, because rather than making graphics to support your content on social, you already have an entire infographic to break down and use for social promotion. Use this awesome social media size guide and then choose the best times to share. Neil Patel also has a very resourceful blog that includes several ways to uniquely promote your infographic. Some of my absolute favorite places to share CoSchedule's infographics are Slideshare, Pinterest, and our Resource Library. Together, they bring new traffic to the infographic even beyond the blog itself. Some other great places, that are also free, include Fast Company's Infographic of the Day, Visual.ly, and Love Infographics. Before you know it, you’ll be sharing like a pro and your infographic will go viral. Here's How To Get Started:- Choose your favorite three places to share.
- Pick a consistent day and time to share your infographics to each site.
- Track your results in Excel, Evernote, or Google Sheets.
- Evaluate your results and adjust to reach the optimal traffic.


