How to Drill Into Data To Extract Powerful Social Media Insights

 Having the right data is important for social media success.
However, even the best data in the world is useless if you don't know what it all means.
In order to unlock the power of your analytics, you need to know how to extract useful social media insights from them.
In this post, you’ll learn how to:
Having the right data is important for social media success.
However, even the best data in the world is useless if you don't know what it all means.
In order to unlock the power of your analytics, you need to know how to extract useful social media insights from them.
In this post, you’ll learn how to:
- How to interpret the data you’ve found and get actual meaning from it.
- How to explain the numbers and more to a client or team.
- How to update your social media tactics based on the insights you’ve found.
What Are Social Media Insights (And Why Do They Matter)?
The term "social media insights" can mean different things to different people. For our purposes, though, we'll define social media insights as the actionable takeaways you produce from analyzing your social media data. In this post, we'll walk through a retroactive process that'll allow you to analyze past content, figure out what made it successful (or not), and better understand what to do (or not do) in the future. Get it right, and you'll be able to fine-tune your copy and imagery to best connect with your audience.How to Drill Into Data To Extract Powerful Social Media Insights
Click To TweetBefore You Continue, Download Your Social Media Insight Analysis Template
Before you can extract insights from your social media marketing data, it helps to have somewhere to record it all. That's exactly what you can do with this free template, making it easier to narrow down what, exactly, led each post to perform as well (or ... maybe even not so well).Start By Finding Your Top-Performing Posts
The first part of determining insights into your social media channels involves determining your top posts. Top posts can be found in a number of different ways but it all depends on what the overarching goals of your channels are. For example, if your goal was to drive engagements, you’d be looking for the posts with the most likes, shares, and comments. However, if you’re looking for posts with the most clicks to your website, you’d be tracking link clicks via each social channel’s in-app analytics or an external tool like Google Analytics.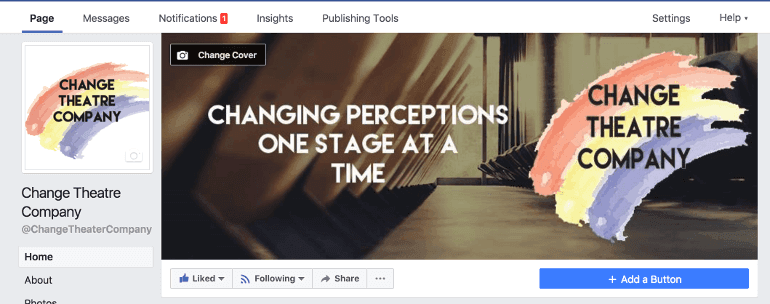 From there, go to Posts:
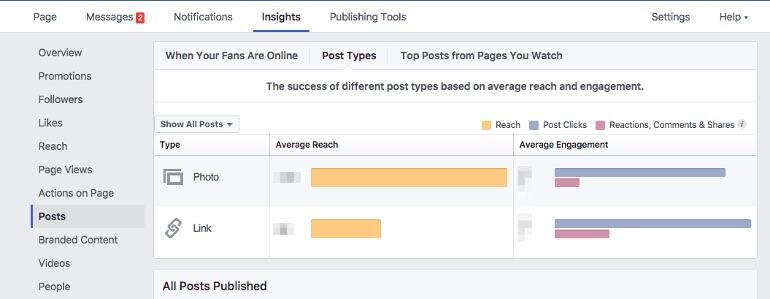 In your Posts section, scroll down to All Posts Published, and there you’ll be able to see the different metrics for each one of your posts:

 Then in the menu bar, select Tweets:
 That screen will show you all of the engagement data, and impressions that your tweets have generated for the past 28 days, as well as allowing you to see the top tweets you’ve sent in that time period:

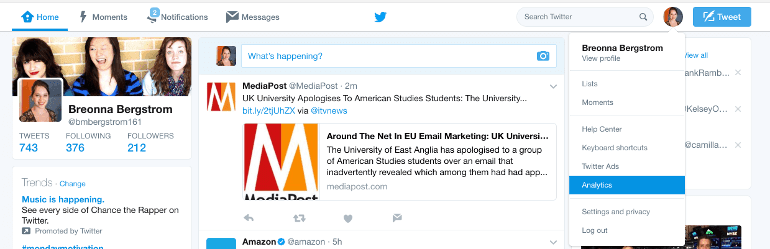
 Once you’re in the Analytics section, scroll down to Posts, and then click on See More:
 The analytics for your Instagram profile is a bit different because you need to click on each individual post to see its engagement metrics:

 The nice thing about Pinterest is that your top pins are all located in one place. Just scroll down your screen to see them all:

- Impressions
- Clicks
- Interactions
- Engagement rate
Develop Your Post Analysis Process
Once you've gathered your data and found the top posts you'll analyze, you'll need a repeatable process for uncovering social media insights. This essentially means knowing which questions to ask to figure out what caused content to perform as well as it did. Try following this graphic below: By asking each of these questions as you analyze each post, you'll start to identify patterns impacting post performance. You'll be able to record a lot of this data in the downloadable template included in this post (which we'll cover in more detail in a little bit).
How Does Voice and Tone Impact Social Media Post Performance?
What you say and how you say it on social media is essential for ensuring your posts convey your messages the way you want them to be felt. So, how exactly does your choice of verbiage and emotional sentiment impact audience engagement, and how can you determine its effect on post performance?Recommended Reading: The Best Social Media Copywriting Guide to Be a Social Media Word Ninja
Does Your Post Have a Positive or Negative Sentiment?
Are you trying to lift up your followers or inform them of some bad news? The sentiment your message sends can affect the interactions you receive from your audience. Being able to track what types of tones they are responding to is a great way to determine what types of posts you should be sending. Here is an example of a post with a positive tone:https://twitter.com/CoSchedule/status/877549014153138178And here's an example that elicits more negative emotions: https://twitter.com/Conductor/status/879729292799823872
Are Your Post Questions Open Or Closed Ended?
Are you encouraging discussion with your social media messages or closing them off and creating a more informational style post? Often times you’ll see more engagement with open-ended questions because it gives your audience a chance to respond back to you, instead of just acknowledging they saw the message. Here is an example of an open-ended social media post:Are you ready to run? We want to know who is participating in the Fargo Marathon this week? What events are you doing?... Posted by Hilton Garden Inn Fargo on Wednesday, May 17, 2017
For your chance to win a FREE night stay, head over to our sister property's page and check them out! #teamRaymond #freenightstay #nationalpetday Posted by Hilton Garden Inn Fargo on Tuesday, April 11, 2017
How Long Is Your Post Copy?
Depending on the social channel you’re working with, the length of your post could affect the interaction your audience has with it. The optimal length post will vary per channel (and could even vary by industry, or even your specific business and audience), but here is a whole list to help you get started.Recommended Reading: How to Write for Social Media to Create the Best Posts
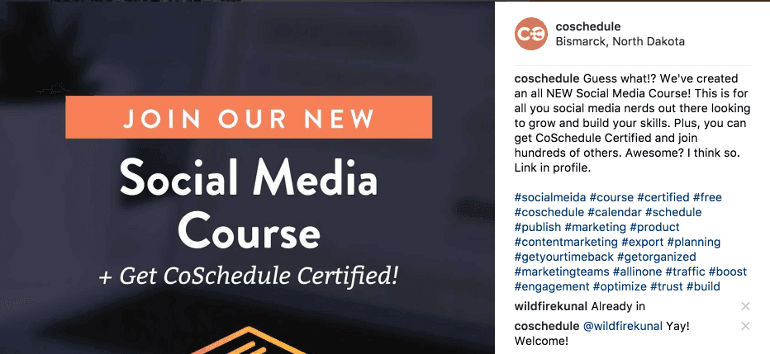
Did Your Post Incorporate Hashtags?
Hashtags can have a powerful impact on how far your posts reach. If you use hashtags on networks that don't support them well, though, they could actually negatively impact your post performance. For some networks to connect to followers, you need to have a lot of hashtags, while for other networks having any hashtags can actually cause a decrease in content views. For example, Facebook should be a hashtag free zone. Why? According to Crazy Egg, hashtags are meant to help users search out information on a subject. Facebook users control that already because they are choosing who and want they want to see in their newsfeeds. Instagram on the other hand, should be full of hashtags. Why? Because according to that same Crazy Egg post, to find and interact with content, you want to see you have to search for it. Hashtags make your content searchable.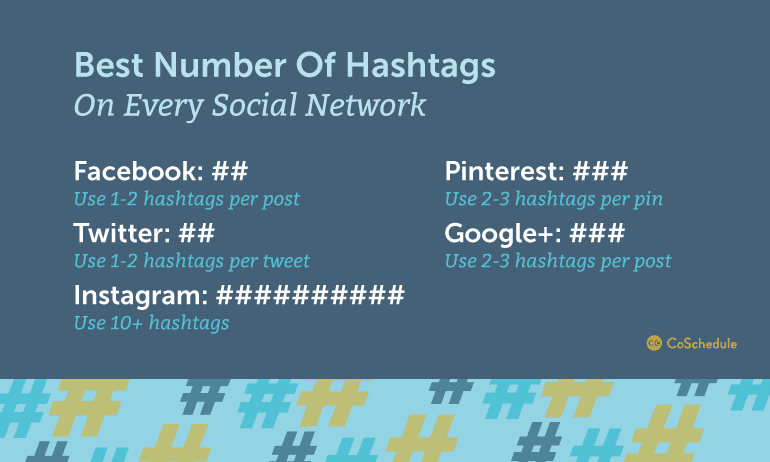
Should You Be Using Emojis?
No one can say that emojis aren’t fun. These tiny little pictures are changing the way we communicate, one keyboard at a time. What channel you should be using emojis on is difficult to determine, as they can sometimes come across as unprofessional. Not to mention emojis, and their meanings are not always as black and white as they may seem. Social Media Today broke down when to use emojis and what they mean on their blog. An example of a hashtag style emoji. https://twitter.com/MeghanRienks/status/879403763156393985An example of a standard use case for emojis.
Are You Creating Broadcast Or Discussion Posts?
The final element we'll focus on are broadcast posts versus discussion posts. Broadcast posts are posts that are designed to promote your brand or business. They usually sound more like ads and focus mainly on what you can do for your followers. As Rich Mcelaney put it in this blog post for BrassCycle:“Imagine having a conversation with someone (and we all know people like this) where you ask, “How are you?” and they launch into an in-depth explanation of every moment of their life since you last saw them. They don't take a breath. If you try to interject with a story of your own, you can see them simply waiting until you stop talking so they can continue.”Discussion posts are specifically developed to create conversations with your followers. They create conversations that allow your followers to interject and control more of the conversation, which creates a more trustworthy atmosphere. A broadcast post will look something like this.
“Without a song or a dance what are we”, think about it! Or just come to theREP to see Mamma Mia, Performances start Friday, July 7 and goes until Sunday, August 13. Get your tickets today: http://bit.ly/2qMQx4 Posted by Capital Repertory Theatre on Monday, June 26, 2017
Are You Posting At The Right Time?
The next section of metrics that you can focus on involves time. What time your posts go out determines how many people in your audience will see it. Obviously, there are times that certain social channels are more active. Those prime times can be found in this blog post, that has been backed by over 16 studies. It’s also important to post your social media messages on the right day. By posting at optimum days and times you’re able to maximize the views that your messages will receive. The more eyeballs you have on a post, the more likely you are to create the engagement and or link clicks you need.Recommended Reading: What 20 Studies Say About the Best Times to Post on Social Media
Are Images And Video Adding Engagement To Your Social Media Messages?
The next set of attributes that you’re going to want to record focuses on the different types of media that you’ll have for your posts. Visuals like videos and images are becoming a major key to successful social media posts which was outlined by Hubspot earlier this year.Image and Video Colors
The psychology of color plays a much more important role than you might think. Saying things like “red makes people angry” or “blue creates feelings of calm” are not necessarily accurate because everyone’s personal experiences are different, therefore colors will evoke different emotions in all people. However, according to SnapHelp, 90% of instant decisions are made on color. They say that audiences are more susceptible to color based on how they think it fits a product. So the colors you choose for your social media channels can have an effect on your audience because they are looking to see if your color scheme fits your brand. For example, we’re used to seeing bright, electric colors in Disney photos and images because the park is always alive and going. People are never sad at Disney world and their color scheme fits that brand perception.Memorable Dining Experiences | Walt Disney World From holding court with royalty to good old-fashioned family gatherings, a Grand Adventure to Walt Disney World serves up memorable dining experiences for both you and your grandkids! Learn more - http://di.sn/61818l3UT Posted by Walt Disney World on Thursday, June 8, 2017
Recommended Reading: The Know-It-All Guide to Color Psychology In Marketing + The Best Hex Chart
Video Subtitles
This next metric focuses on video alone. With more and more videos starting automatically as people scroll through social media, a lot of people are opting to have their sound off. But if you audience member can’t hear what your video says you’re suddenly missing out on a potential customer. This is where subtitles are coming into play. According to Media Cause, about 82% of social media video views are watched without sound, making subtitles vital. Take Tasty for example. I’m willing to bet you’ve seen one of their recipe videos at least once. The unique thing about those videos and one of the reasons they’re so successful is because they have captions that walk you through the whole recipe. You don’t have to turn the sound on to get the message.Fidget Spinner Cookies Feeling stressed? Make these fidget spinner cookies so you can spin AND eat the stress away ?! FULL RECIPE: http://bzfd.it/2s4juqZ Posted by Tasty on Tuesday, June 13, 2017
Video Length
The second metric that is focused solely on video is the length of your videos. Channels are optimized for certain video and lengths and some will even limit how long videos can be. For example, videos on Instagram need to be under a minute. Not to mention, videos are now being viewed more often on mobile devices and according to social media today, you have less than two seconds to grab the attention of your viewer. So the number of interactions you have per video can be traced back to how long your video is.
Recommended Reading:
The final metric that you’re going to be recording on your template are interactions with your audience on your posts. Giving your audience a real response from your social team makes them feel valued because they know you saw their comments. You’re showing them that their voice matters to you.
That’s why I tweet a Diet Coke all the time; they respond to me and make me feel special. And who doesn’t like being special?
- How to Do Facebook Video Marketing the Right Way
- How to Make a Video Content Marketing Strategy That Will Engage Your Audience
Measure Interactions With Your Audience
Recommended Reading: 30 Social Media Engagement Tactics That Will Boost Shares And Conversions
You’ve Collected The Data, Now You Need A Place To Record It And Your Insights.
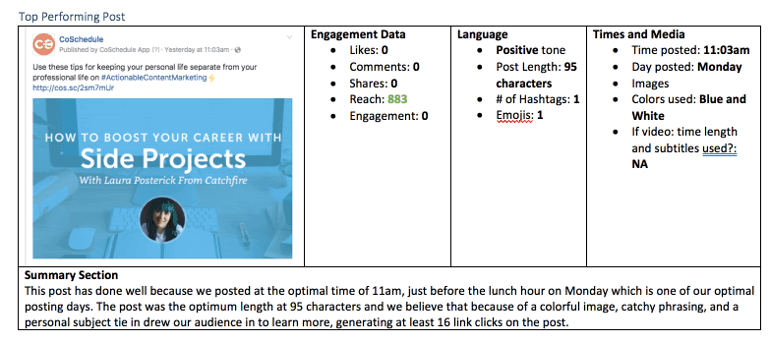
The Social Media Insights Document that you downloaded earlier will help create the report that you can show to your bosses or your clients. Open your social media insights report and each of your social media channels: In the process that we demonstrated earlier, find your top post and take a screenshot to insert into your report:
 From there record the likes, comments, shares (if applicable), reach and engagement that your post received:
 Then you can record the language insights we touched on earlier including, tone, post length, the number of hashtags, and emoji use:
 The last section of numerical data that you’re going to record in your post is on times your post went out and media types that you used:
 The final part of your chart is a summary section. This is the space where you’ll be able to layout in two to three sentences what all that numerical data means to you clients or bosses. For example, in this post, we can conclude that because the post when out at 11 am on a Monday and had a personal note in its tone, it caused people to click on the link at least 16 times:
 You’re going to repeat the same process for top three posts on every channel as well as the lowest engagement post. The reason you should include your lowest performing post is that you don’t want to make your boss or client think that everything is perfect. By showing the posts that need some work you’re able to determine what needs improvement and continue to grow your strategy.
Recommended Reading: How to Create a Social Media Strategy (With 3 Steps And a Template)
Let’s Wrap This Up
With all the knowledge you have now, you’ll be able to take the numerical data you’ve gathered and make it digestible for your clients and your boss. Not to mention you’ll learn how to adjust your social media strategy based on the conclusions you reach.Here's how to dig deep into social media content analysis:
Click To Tweet


