
An AI Insights dashboard is a custom report: it keeps the charts you choose from Insights Assistant in one place, so you can track the metrics that matter most to you. Available on Professional and Suite.
Create a dashboard
- From your calendar, click Analytics in the sidebar menu.
- In the Analytics sidebar, click Create Dashboard.
- In New Dashboard, type a name in Dashboard Name.
- Click Save.
Add a chart to a dashboard
- From your calendar, click Analytics in the sidebar menu.
- Under Insights Assistant Reports, select a prompt to run it.
- On the chart, click the dot menu in the upper-right corner.
- Choose Add to Dashboard...
- In Select Dashboard, choose a dashboard, or choose New Dashboard.
- Change the Chart Name if you want.
- Click Add to Dashboard.
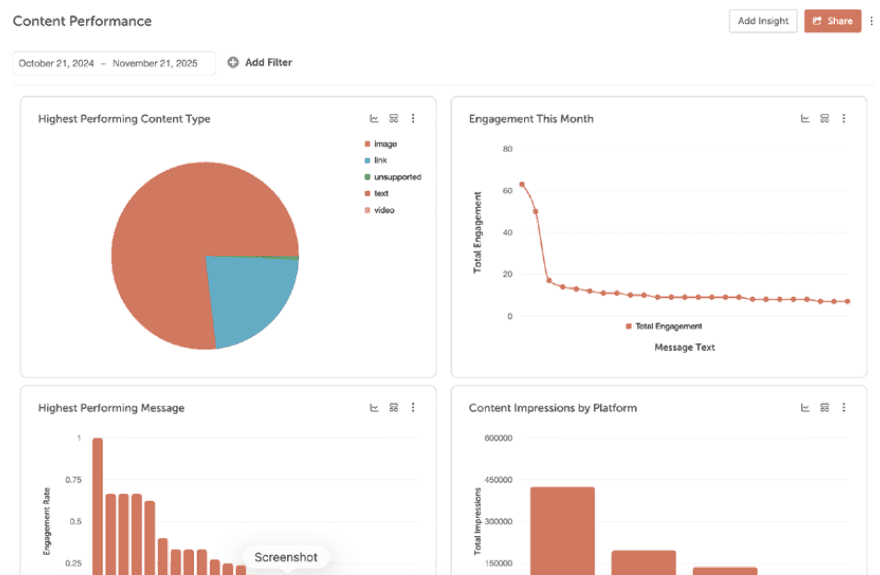
On the dashboard, arrange the charts in the order that fits your workflow, and filter them by date range, social profiles, color labels and tags.
Create as many dashboards as you need, for example one per network, client, metric or time period. When you open a chart from a dashboard, click Back to Dashboard to return to it.
Rename a dashboard
- Click the three-dot button on the dashboard (its tooltip reads "Additional Options").
- Choose Edit. Edit Dashboard opens.
- Change the name.
- Click Save.
Delete a dashboard
Deleting a dashboard removes all the charts in it, and it can't be undone.
- Click the three-dot button on the dashboard (its tooltip reads "Additional Options").
- Choose Delete. Delete Dashboard opens.
- Type DELETE.
- Click Confirm.
Export or schedule a dashboard
A dashboard's Share menu offers Schedule Report, Export PDF and Export CSV. For the steps, see Export and schedule reports.