
The Social Campaign Report shows how the social messages in a campaign performed, and lets you compare one campaign with another. Available on Starter, Professional and Suite.
It covers Facebook, Instagram, X, LinkedIn, YouTube Shorts, TikTok, Threads, Bluesky and Mastodon.
Open the report
- From your calendar, click Analytics in the sidebar menu.
- Choose Social Campaign Report.
- Click Choose a marketing campaign or project, then select the campaign you want to see.
- To compare it with another campaign, click Add a marketing campaign or content to compare.

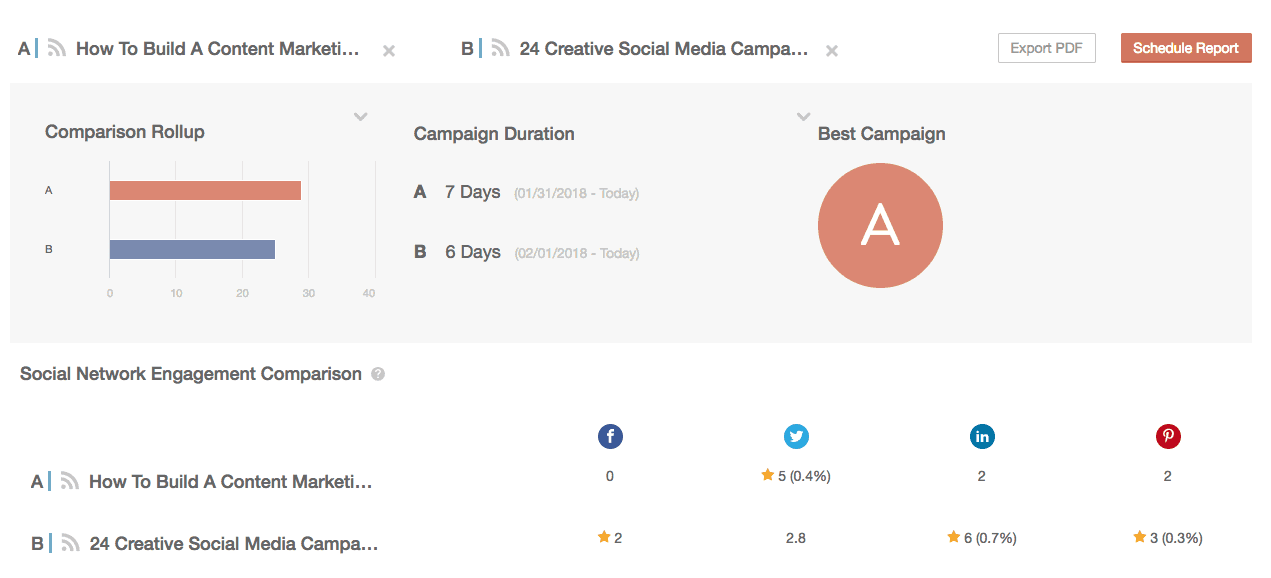
This report covers the whole life of the campaign. To see a campaign's results for a set date range, open the Social Engagement Report and filter it by the campaign's tag.
The free plan doesn't include social analytics.
What each section shows
Engagement Rollup
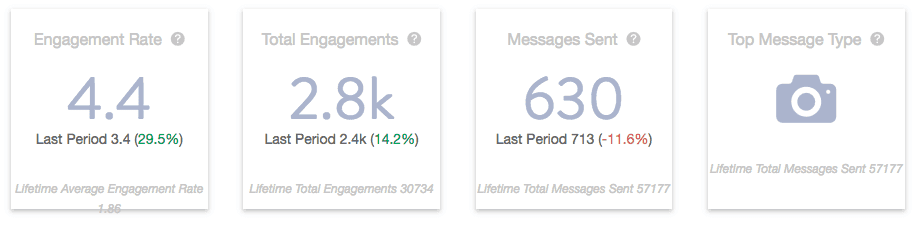
The campaign's average engagement, total engagement, messages sent and top message type. Global Eng. Rate is your whole calendar's engagement rate across all networks for the last 90 days, shown so you can compare the campaign with your usual results. It's hidden while you compare campaigns.
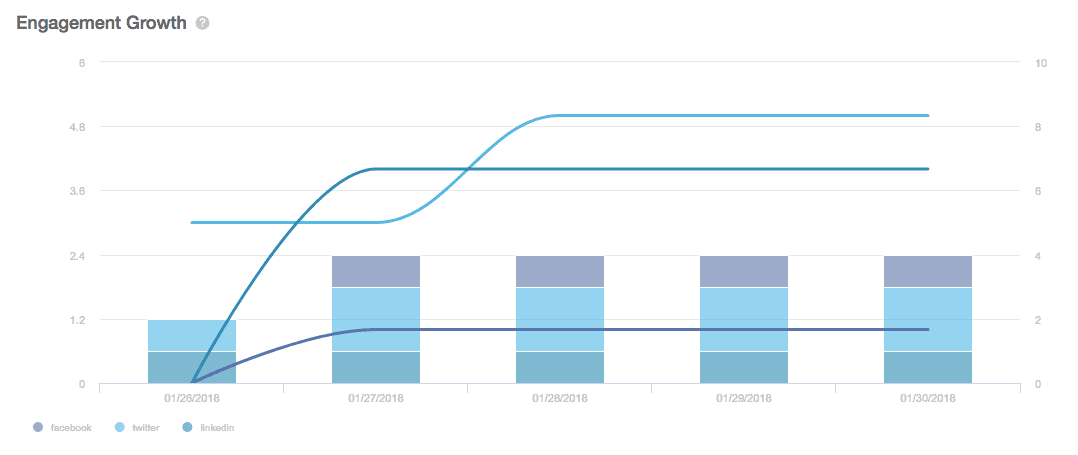
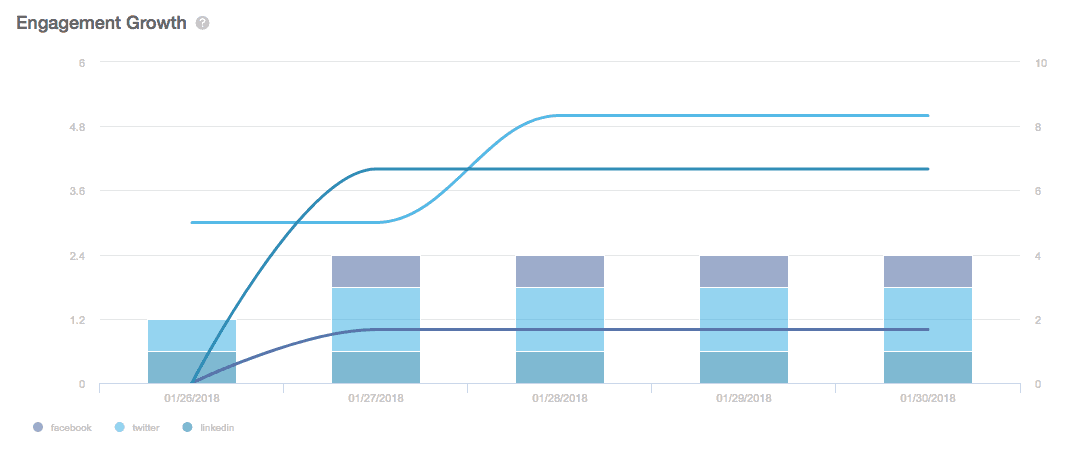
Engagement Growth
The number of messages published next to the engagement they earned over the campaign.
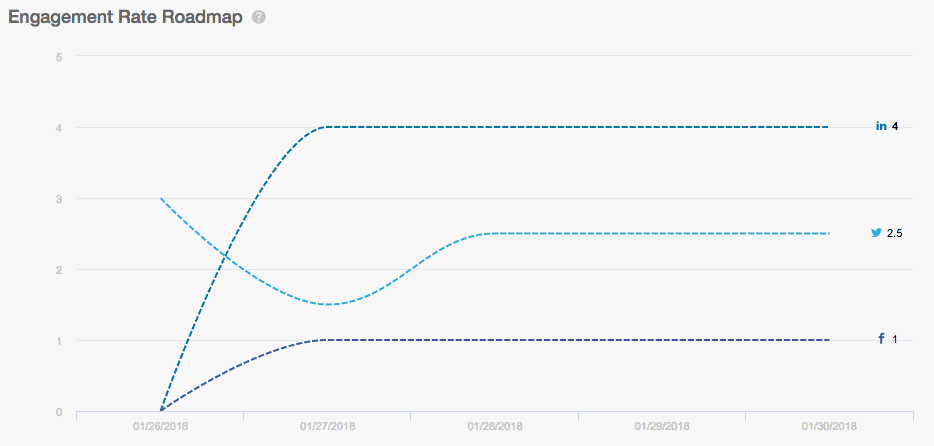
Engagement Rate Roadmap
Engagement rate trend lines for each social network, so you can spot trends in the campaign.
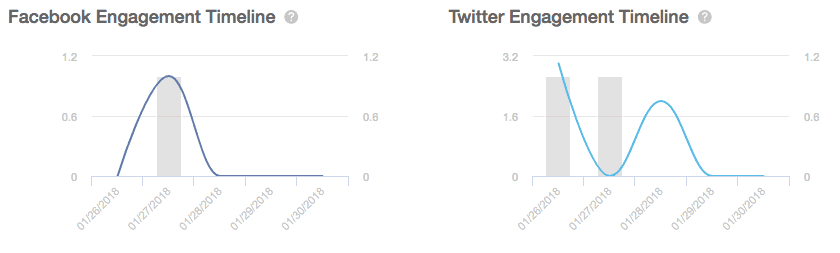
Engagement Timeline
Likes, comments and shares for each social network over the campaign.
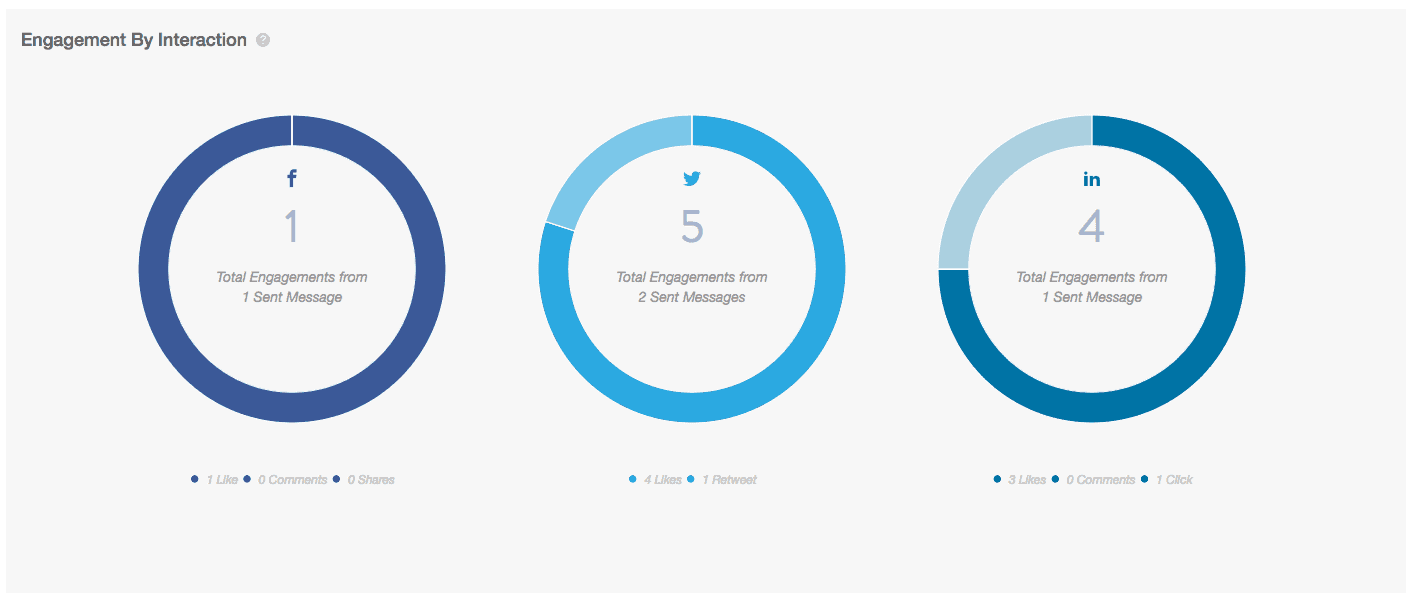
Engagement by Interaction
Likes, comments and shares broken down by network, with the top-performing channel.
Account Performance
Engagement broken down for every social profile used in the campaign.
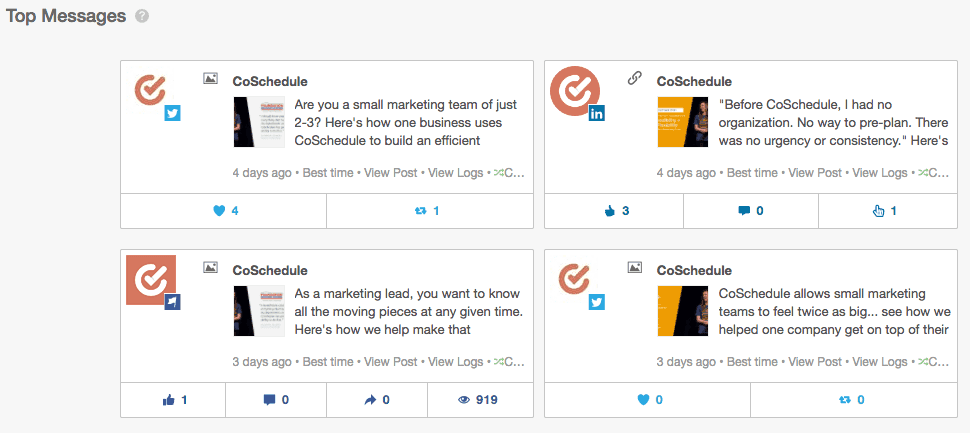
Top Messages
The messages that earned the most engagement over the campaign.
How engagement is calculated
Engagement rate is the campaign's total engagements (likes, comments, shares and clicks, depending on the network) divided by the number of messages sent. What counts as engagement differs by network; see What each analytics metric means.