
The Social Engagement Report shows how the social messages you schedule with CoSchedule perform across your profiles. Available on Starter, Professional and Suite.
It covers Facebook, Instagram, X, LinkedIn, YouTube Shorts, TikTok, Threads, Bluesky and Mastodon.
Open and filter the report
- From your calendar, click Analytics in the sidebar menu.
- Choose Social Engagement Report.
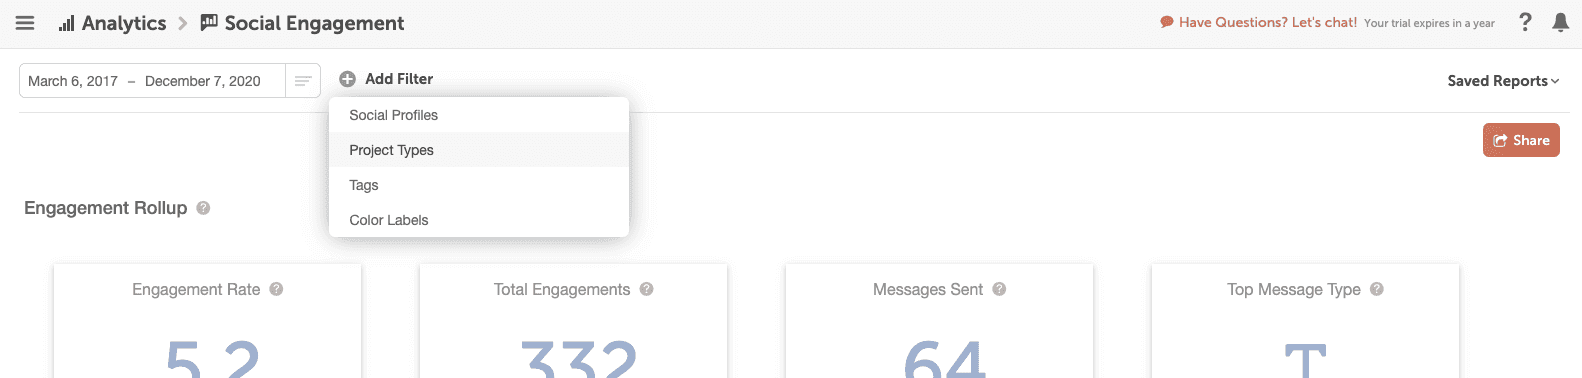
- Choose the filters you want: Social Profiles, Project Types, Tags or Color Labels.
- Choose a date range. Pick a predefined range, such as Last 30 days, or click the dates shown in the fields to set your own.
The free plan doesn't include social analytics.
Save a report view
Save a set of filters as a report view to open the same report again quickly.
- Open the Saved Reports dropdown.
- Click Save New Report View. A name field opens.
- Type a name for the view.
- Click the checkmark icon or press Enter to save it. To cancel instead, click the X.
What each section shows
Engagement Rollup
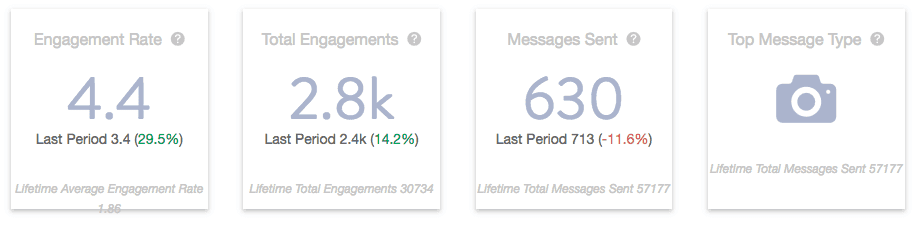
Your average engagement, total engagement, messages sent and top message type for the date range. Each number is compared with the "Last Period": the period of the same length just before your range. For example, Last 30 days compares with the 30 days before that, and Last 3 months compares with the 3 months before that.
Lifetime Avg Engagement Rate, the note under the Engagement Rate card, is your total engagements divided by messages sent across your whole calendar since you started. It ignores the date range and filters, and it's engagements per message, not a percentage.
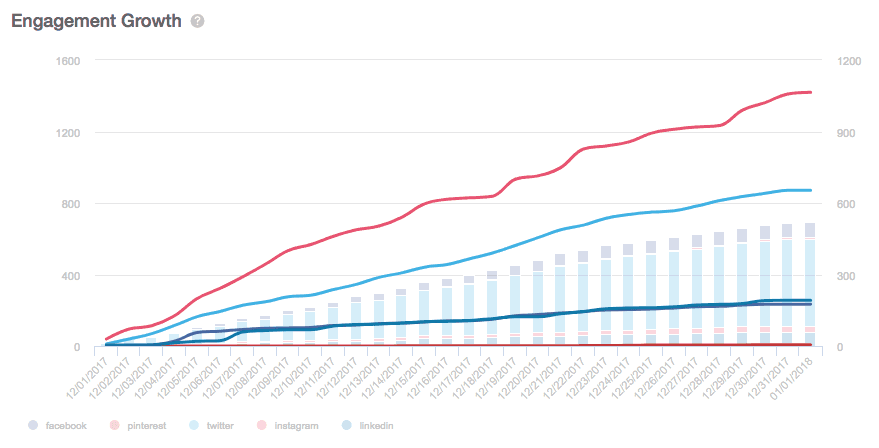
Engagement Growth
The number of messages sent next to the engagement they earned over the date range.
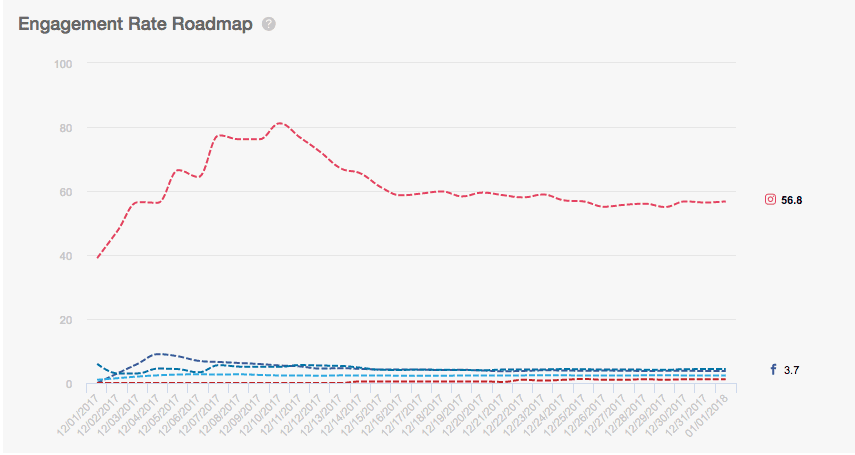
Engagement Rate Roadmap
The peaks and valleys in your engagement rate for each social network.
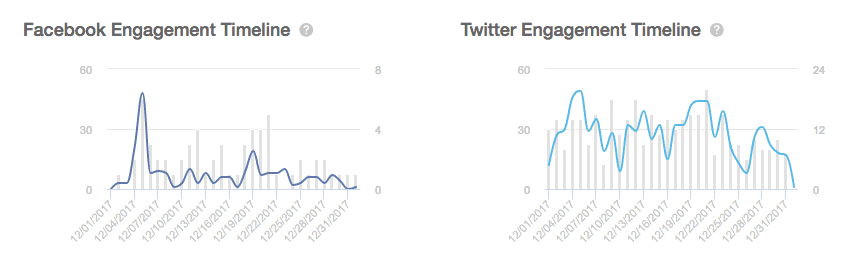
Engagement Timeline
Engagement compared with messages sent over time.
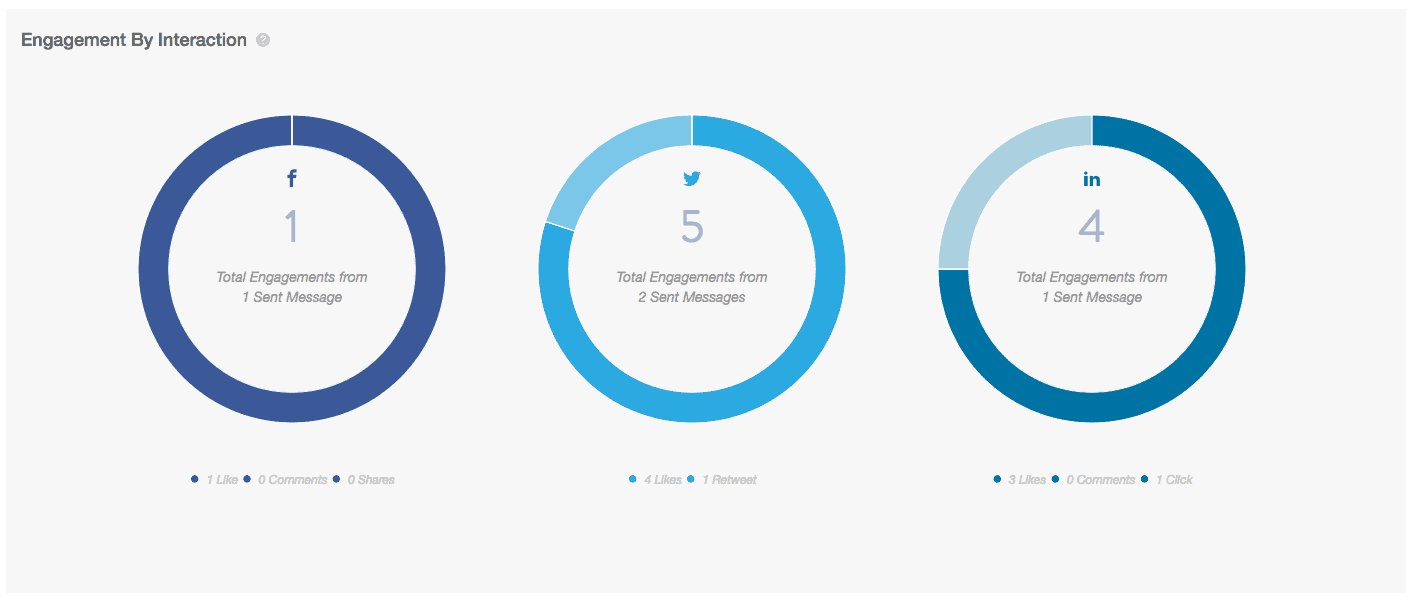
Engagement by Interaction
Engagement broken down by network, with your top-performing channel.
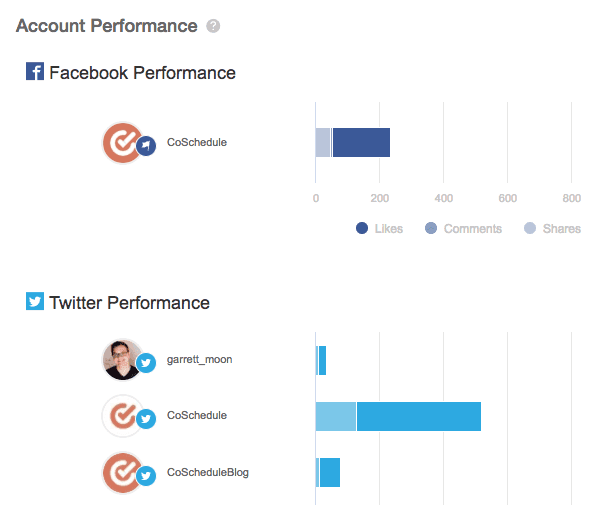
Account Performance
Engagement broken down for each social profile in the report.
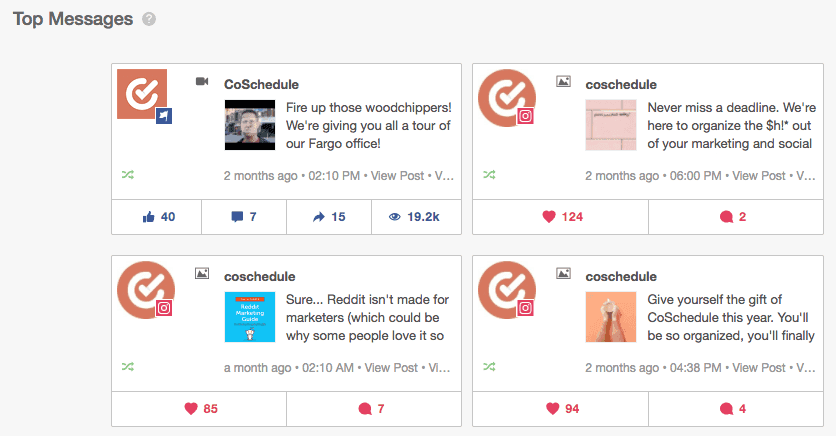
Top Messages
The messages that earned the most engagement during the date range.
Common reports
- Posts with one tag over a date range: set the date range, then filter by Tags.
- Several campaigns in one report: give the messages in each campaign the same tag, then filter by that tag.
- A report to share: export it as a PDF or CSV, or email it on a schedule. See Export and schedule reports.
How engagement is calculated
Engagement rate is your total engagements (likes, comments, shares and clicks, depending on the network) divided by the number of messages sent. What counts as engagement differs by network; see What each analytics metric means.