The Best Social Media Report Template to Show Your Results

 Social media analytics can hard to translate for clients or coworkers who have little knowledge about each channel. You need to be able to clearly explain what you and your team are doing to justify your budget.
Building social media reports can help you do that.
But, you can’t just throw some numbers in a spreadsheet and call it good. Your report needs to be visual, comprehensive, and easy to skim, but also include enough information to prove your work is producing results.
The takeaways you'll pick up from reading this post are:
Social media analytics can hard to translate for clients or coworkers who have little knowledge about each channel. You need to be able to clearly explain what you and your team are doing to justify your budget.
Building social media reports can help you do that.
But, you can’t just throw some numbers in a spreadsheet and call it good. Your report needs to be visual, comprehensive, and easy to skim, but also include enough information to prove your work is producing results.
The takeaways you'll pick up from reading this post are:
- How to quickly and easily compile a social media report. We'll walk through every step of the process.
- How to explain social media data to your client or team members. We'll cover how to analyze your social media data
- How to prove social media marketing is working for your business. We'll show you how to show you're making a difference.
Keep It Simple And Download Our Social Media Report Templates
Make social media reporting easy with these three free templates. Download this bundle and you'll get:- Weekly Social Media Report Template to keep your team and organization up-to-date week to week.
- Quarterly Social Media Report Template to present your quarterly progress (when you'll likely meet with execs, clients, and key stakeholders).
- BONUS: Social Media Posting Schedule Template to plan out your posting frequency (which you can optimize over time as you see what's working, and what isn't, over time).
The Best Social Media Report Template to Show Your Results
Click To TweetWhy Build Social Media Reports?
Social media reports help you understand what is and isn’t working in your strategy. They also help you prove that your efforts are working, as well as provide transparency throughout the company as to what your team is doing.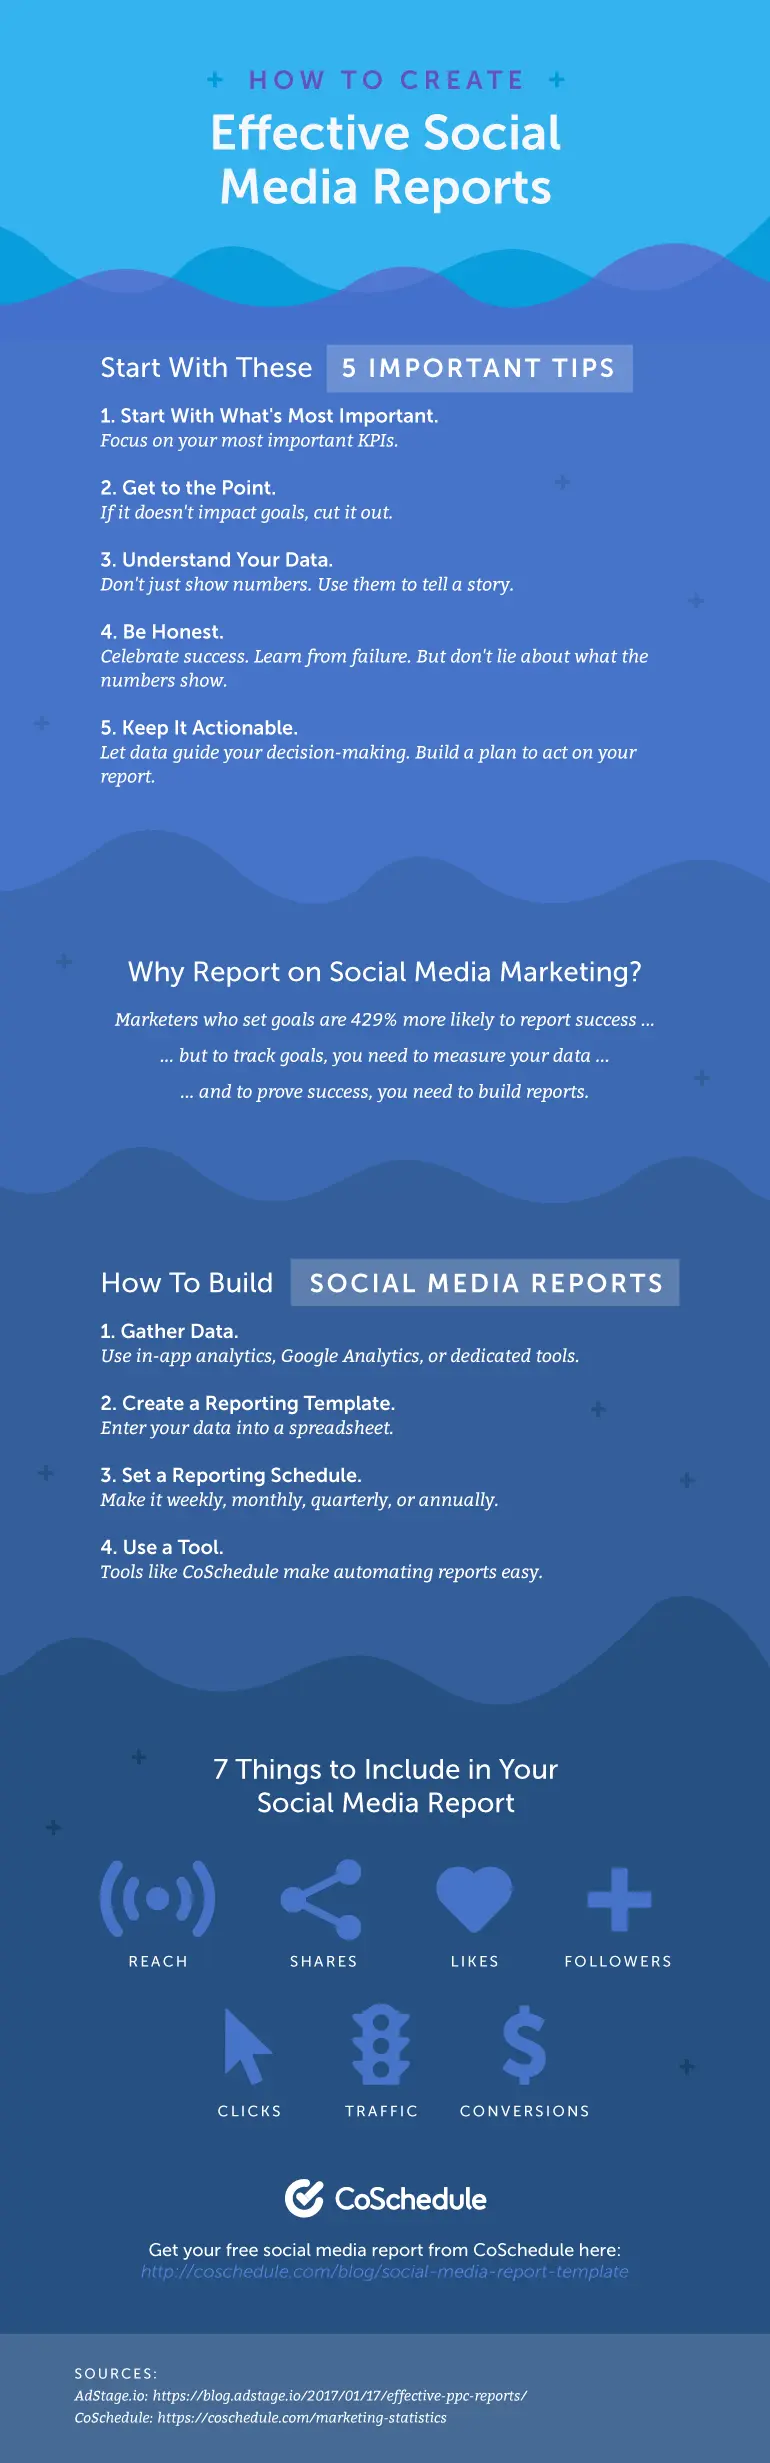
Not Sure How Or Where To Gather Your Data?
These report templates require a lot of data research to complete. You can find most of that data in different app analytics sites as well as Google Analytics. Check out these resources to find all of the data you need:
Before you finish reading...
Check out Actionable Marketing Institute powered by CoSchedule! AMI has a course focused on Social Media Strategy. Follow the step-by-step guide on creating a results driven social media strategy. By following lessons, videos, and tutorials you are setting your social media up for success, expect boosted traffic, improved engagement, and a stronger sense of social media community. Learn more about Social Media Strategy here.
Now, Let’s Walk Through How To Use Your Free Report Templates
The next part of this post will walk you through what each section of the report template means and how to explain the data to your team.Social Channel Reach
Social channel reach data talks about how many people saw your post in their newsfeeds. They don’t have to interact with your post at all in their feeds; they just need to scroll past it. So why should you care about reach?
Reach can tell you how many eyes have seen your content, which in turn can help your team establish on average how many people see your content.
As you enter your data into the table, the graph below will adjust:
To enter your data:
So why should you care about reach?
Reach can tell you how many eyes have seen your content, which in turn can help your team establish on average how many people see your content.
As you enter your data into the table, the graph below will adjust:
To enter your data:
- Gather all of the new reach totals for each of your channels.
- Record them in a separate spreadsheet to enter in later.
- Take last week’s reach for one channel and divide it by new reach.
- Subtract that number from 100 and that will be your new percent of change.
- Enter in the new reach total into your chart after the new percent of change has been recorded.
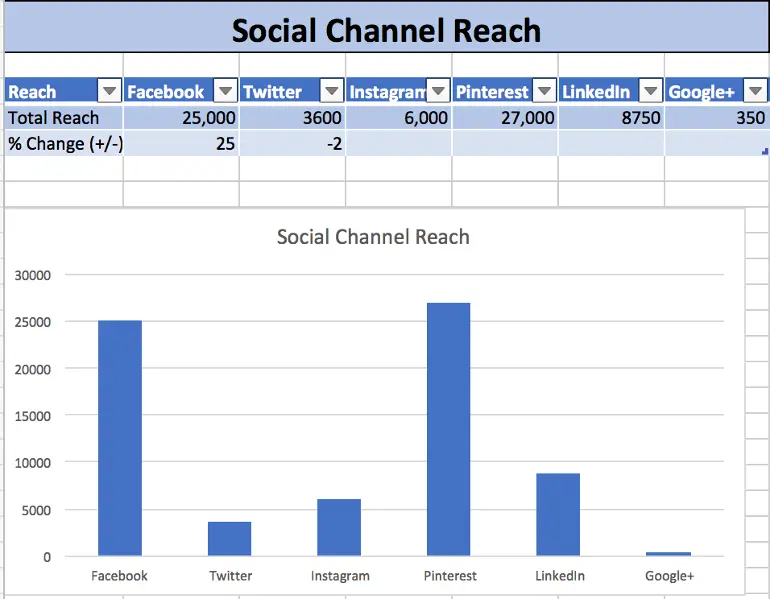
To Fill This Out: Gather your reach data and enter it into the chart above. Keep track of your previous week’s data to find your percent of change.
Social Channel Shares
Social shares are a part of both your weekly report and quarterly report templates. Shares happen any time an audience member shares your content to their newsfeed. Why should this matter to your team or client? Shares help show your team that your audience is finding value in your content. The more often you can provide that value to your audience, the more you create a relationship with them. Social shares in your weekly report are only going to indicate changes over the past week: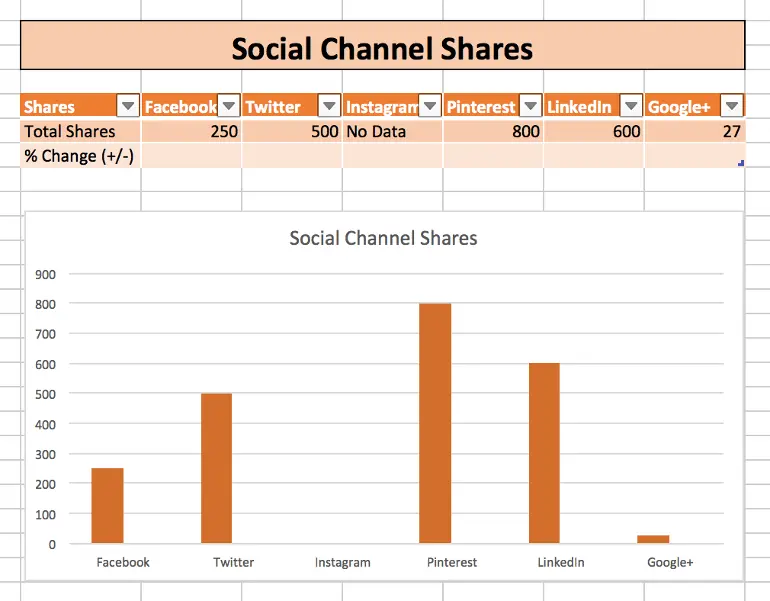 While your quarterly report will show the volume of shares over four consecutive quarters and will look like this in your report:
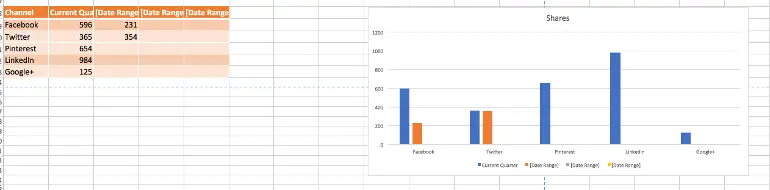 It is important to note that Instagram will not show shares data because as of right now you cannot share other people’s Instagram, except through third party apps.
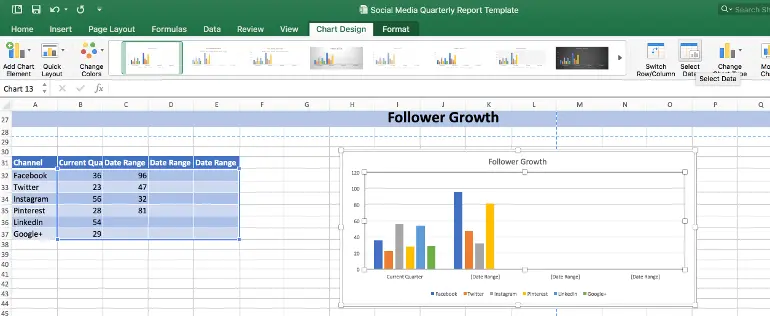
Before you continue, you may have noticed that the bottom of your graph has a legend that says Date Range at the bottom. You may notice that changing the labels in your chart does not modify the labels on the graph.
To update those labels, click on the chart and select, Select Data in the graph menu:
It is important to note that Instagram will not show shares data because as of right now you cannot share other people’s Instagram, except through third party apps.
Before you continue, you may have noticed that the bottom of your graph has a legend that says Date Range at the bottom. You may notice that changing the labels in your chart does not modify the labels on the graph.
To update those labels, click on the chart and select, Select Data in the graph menu:
 A window will appear, and you’ll be able to adjust your dates in the column marked Horizontal Axis:
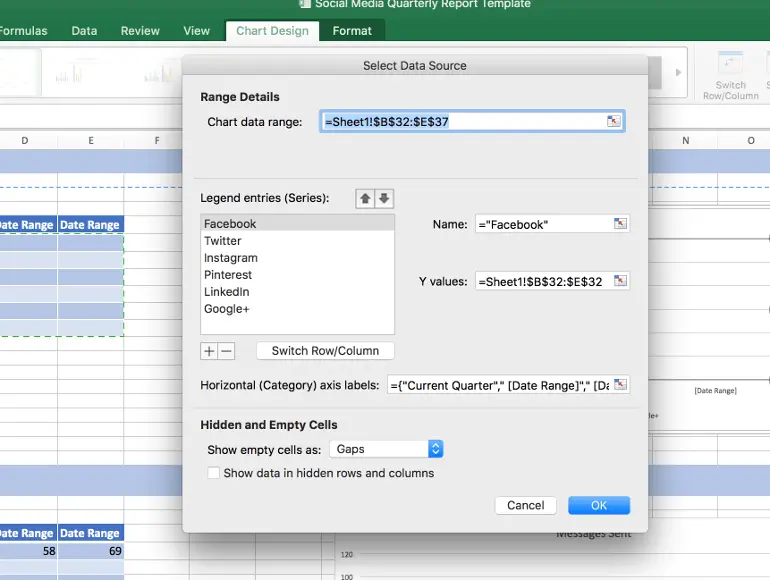 Once you click OK, your graph should update.
To Fill This Out: Gather your shares data for the new week as you did for your reach. Keep track of the previous week’s data to find your percent of change.
To fill out your quarterly chart, you can move the previous week’s data down a week to make room for new data. Both graphs should update automatically.
Social Channel Likes
Likes refer to the number of times that people have interacted with your content by “liking” it. But why would the number of likes on your content matter? Much like when people share your content, liking your content means your audience made a connection with it. Likes allow you to make sure that your topics are on track with your audience preferences. In your weekly report, your chart will look like this: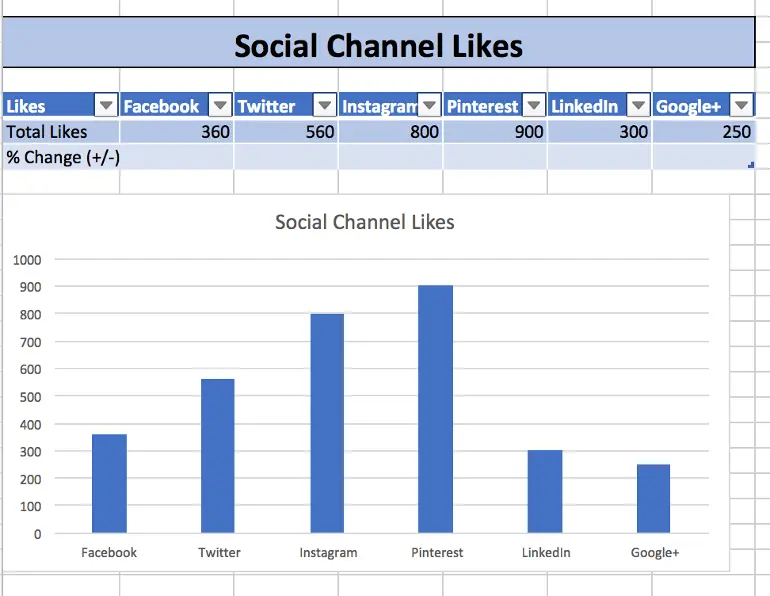 In the quarterly report, your chart will look like this:
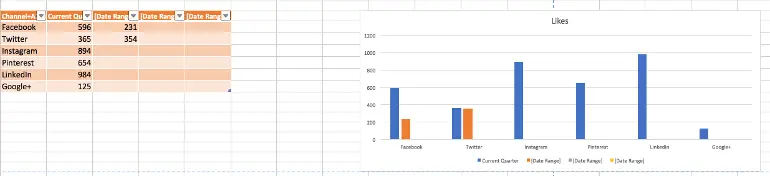
To Fill This Out: Gather your like data for the new week. Just as you did with your previous two graphs, keep track of the previous week’s data to find your percent of change. To fill out your quarterly chart, you can move the previous week’s data down a week to make room for new data.
Social Channel Comments
Social channel comments are another engagement metric that can help show your team and clients that what you’re publishing is connecting with your audience. You can add this into your weekly report if you so choose, however for these templates we’ve only included it in the quarterly report, which looks like this: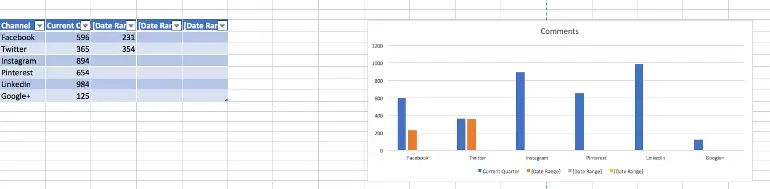
To Fill This Out: In your quarterly report, you’ll be entering in data that you’ve gathered over the previous three quarters. To fill in this chart, move the previous three-quarters of data back a space to make room for your new data. Remember to update the date ranges at the bottom of your chart using the same techniques shown earlier.
Social Channel Follower Growth
The next set of statistics you’ll learn how to record involves how many followers your social channels have gained. Why would these statistics be relevant to your team? The more followers your social channels gain, the more eyes see your content. The more eyes that see your content, the higher probability you’ll have of creating conversions. Plus if you’re gaining a following from fans in your industry or with people that are interested in your company, that means that your content is connecting with the right people. Your follower growth per channel will look like this in your weekly report: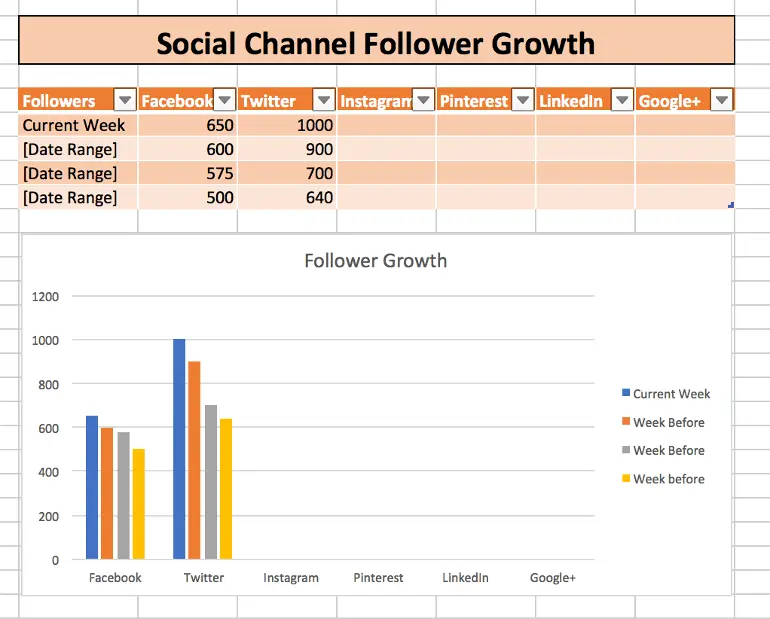 It’s important to note that your follower growth in the weekly reports tracks growth over the last four weeks.
The quarterly report follower growth chart will look like this:
It’s important to note that your follower growth in the weekly reports tracks growth over the last four weeks.
The quarterly report follower growth chart will look like this:
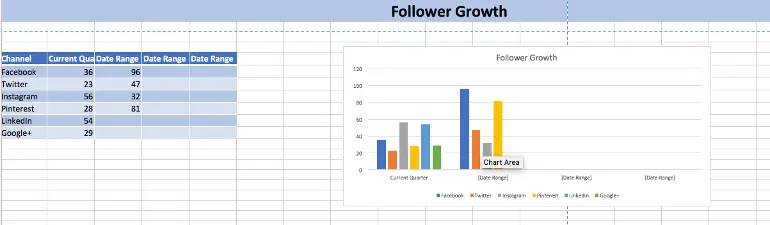
To Fill This Out: Gather your data for the new week. Once you have that done, move your previous three weeks of data back a week in your chart to make room for the new week’s data. You can update the legend in your chart to reflect the new weeks.To fill out your quarterly chart, you’ll use the same process, however, remember the data for this graph should be reflecting every quarter, not every week.
Top Posts Per Channel
The top posts per channel are a key statistic that you can record both weekly and quarterly in your report templates. Why would tracking your top posts be an important part of the data that you show your teams or clients? Because top posts indicate what types of content are connecting with your audience. If you post videos once every few weeks and that video turns out as a top post every time one is sent, it could be an indicator that it’s the kind of content your audience is looking for. In your weekly and quarterly reports, your top posts will look like this: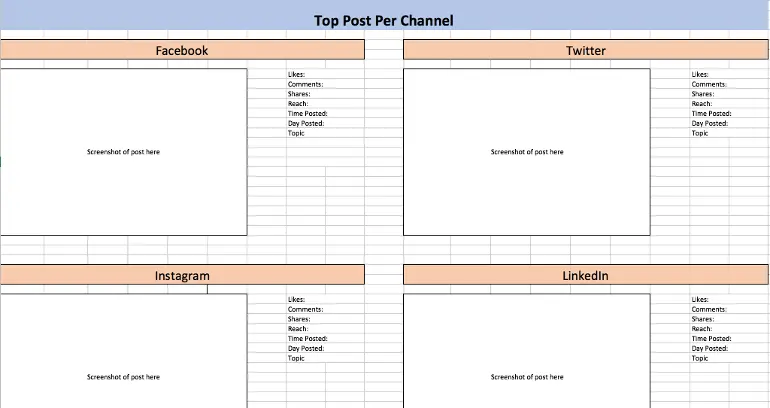
To Fill This Out: Screenshot each of your top posts per channel. Enter those screenshots into the white boxes in your template. You may need to adjust their sizing to get them to fit. Then enter the corresponding data for each post. Every social network should have that information displayed in the in-app analytics.
Social Media Channel Summary
The next part of your report process is going to involve just your weekly report. The totals section is meant to help you track your growth of likes, followers and reach over the course of a month. This small snapshot allows you to track spikes in growth giving your team a chance to analyze what happened over those four weeks to cause the rise. In your weekly report, your total section looks like this: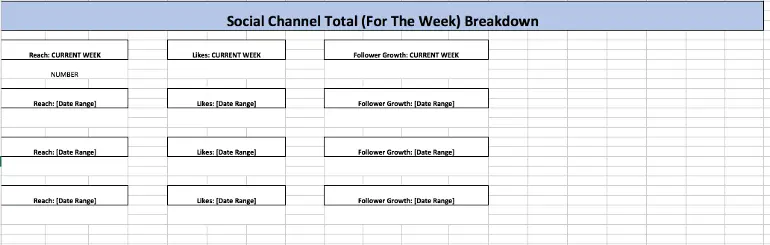
To Fill This Out: You probably know the drill for this by now. To fill out this section, move your previous week’s data back a spot to make room for new data. No sweat, right?
Social Channel Posts Published
The number of social media posts that you have sent is going to be recorded in your quarterly report, not your weekly report. You could add in a section for this on your weekly report, however, if your company maintains a consistent posting schedule, it could get repetitive for your team. Your messages data will look like this in your report: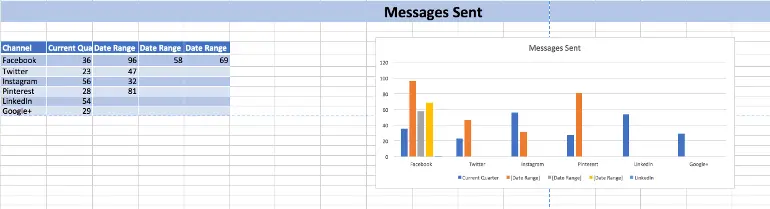
To Fill This Out: Once you’ve gathered the data for each of your networks, you can move your previous quarter’s down to make room in your chart for the newly collected data.
Social Media Traffic
Social media traffic is divided into two different sections for your reports. The first section involves how often your social channels are causing your audience to click to your website. Why is traffic important? Traffic drives people to your website, which in turn should create conversions. The more people you can drive to your website, the more likely you are to create a conversion. Mo’ conversions, mo’ money. In your weekly report, your traffic chart will look like this: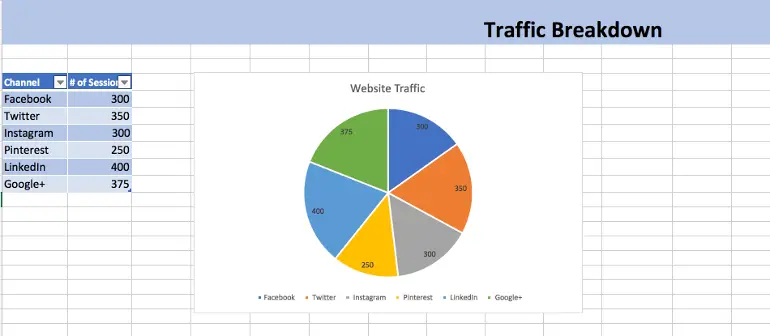 In your quarterly report, your traffic chart will look like this:
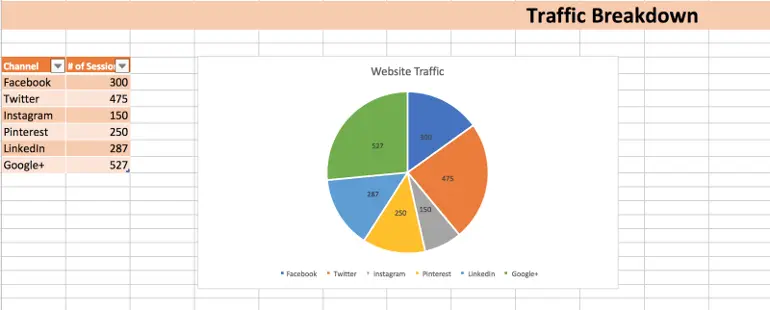
To Fill This Out: Gather your traffic data and enter it into each chart. Your pie chart should adjust based on entered data.
The second part of your traffic data is going to involve recording your highest trafficked content, once a quarter.
In your quarterly report, you’ll find a section for highest trafficked content. It will look a lot like your top content posts section with space allotted to insert screenshots of your post and record the amount of traffic that those posts generated:
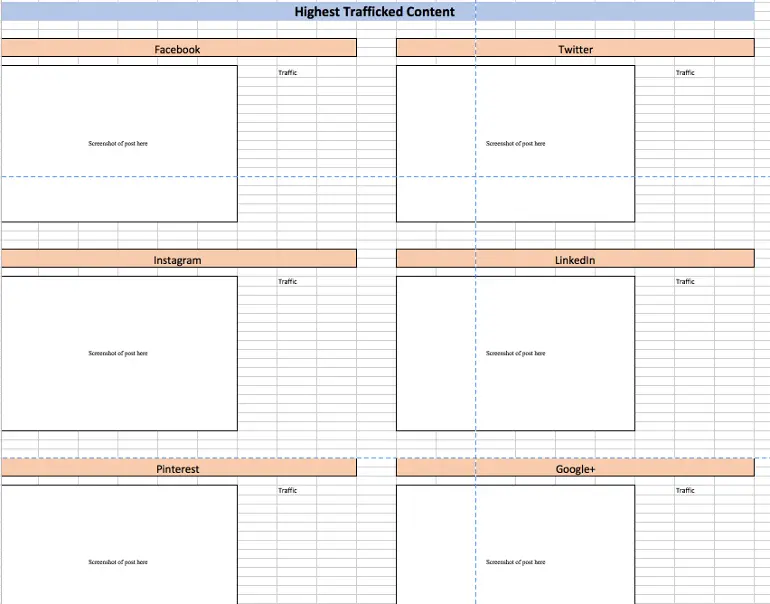
To Fill This Out: Screenshot your posts and insert them into the appropriate boxes.
Social Media Conversions
The second last step in your social media weekly report and the second to last step in your quarterly report will involve reporting your conversions. Conversions are the number of times that your audience members follow through and complete an action that you wanted them to. Conversions can be anything from email sign-ups to buying a product. In your weekly report, your conversion chart will look like this: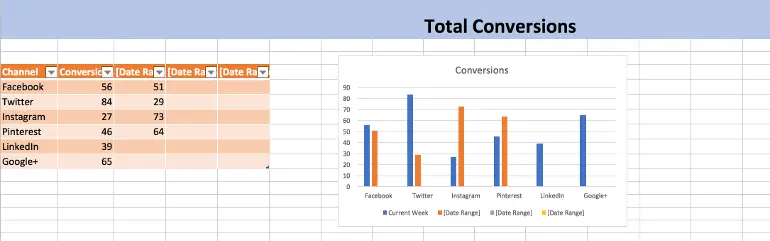 In your quarterly report, they’re going to look like this:
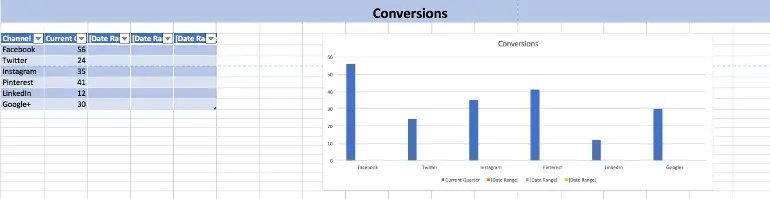
To Fill This Out: You’re going to need the conversion data for each channel, which you can usually find in Google Analytics. Move your data back a week (or a quarter depending on which spreadsheet you’re in) and your graph will adjust automatically.
Social Media Clicks
The last step in your weekly report will involve tracking the number of clicks that your content has received on each channel. Aren’t clicks and traffic the same thing? Not exactly, clicks can refer people to places outside your website, especially if you’re posting curated content. Tracking your clicks in your weekly report is going to look like this: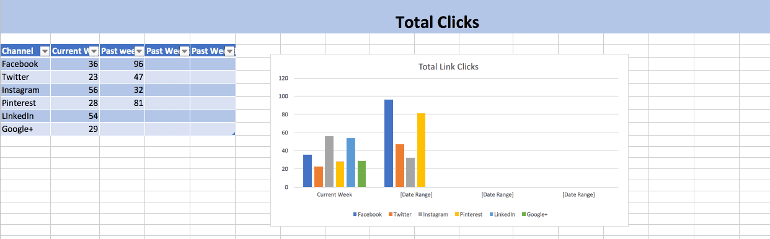
To Fill This Out: Gather you clicks data from each post that you sent out in the past week. Most of that data will be found in your in-app analytics. Enter the data into your chart and wait for the graph to manually adjust.
Top Landing Pages
The last step in your quarterly report is going to involve tracking the top three landing pages for each social media channel that you are active on. Tracking your landing pages can show where your audience is ending up the most often on your website. If it’s where you need them to go, great! If not it may be time to rethink where their initial landing point on your website is. Your top landing pages are going to look like this in your report: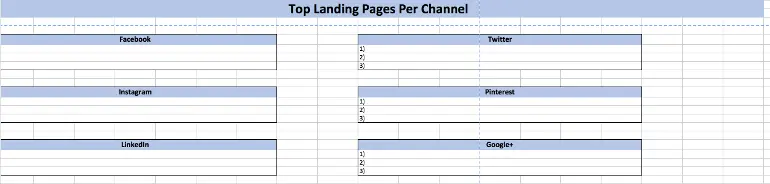
To Fill This Out: Pull your top landing pages out of Google Analytics and insert each URL into each box.
Social Analysis
Okay, so we’re not quite done yet! The *actual* last part of your report is going to involve writing summary notes or details that aren’t explained in the report. This section can be whatever you need it to be in to explain the data to your team:
To Fill This Out: Record any observations or analytics that we’re covered in the report that your team needs to know.
Looking For Templates To Level Up Your Entire Social Strategy?
Actionable Marketing Institute's Social Media Strategy Certification course is jam-packed full of templates and videos to help you create the perfect strategy for your company. Invest in your success. Enroll to gain access to all the tools you need to create a social media strategy focused on results. Check out AMI’s Social Strategy Certification course for more details.
Prove your work is driving results with these free #socialmedia report templates:
Click To Tweet


