How to Perform a Social Media Audit in Five Easy Steps (Template)

 Do you see your social media performance going down recently?
Worried you’re missing out on opportunities to improve your social media marketing?
Or, are you wondering, “How can I tell how I’m doing in the first place?”
If you answered “yes” to any of these questions, it’s time for you to run a social media audit on your channels. It’ll clue you in to your social media performance by channel and post type.
Let’s learn what a social media audit is and how you can perform one for your organization. We’ll give you a template to follow and break the process down into five steps.
Do you see your social media performance going down recently?
Worried you’re missing out on opportunities to improve your social media marketing?
Or, are you wondering, “How can I tell how I’m doing in the first place?”
If you answered “yes” to any of these questions, it’s time for you to run a social media audit on your channels. It’ll clue you in to your social media performance by channel and post type.
Let’s learn what a social media audit is and how you can perform one for your organization. We’ll give you a template to follow and break the process down into five steps.
Snag Your Social Media Audit Template and Checklist
Before you dig into the social media auditing process you’re learning today, take these two templates with you:- Social media audit template: Enter all of your social media statistics into a comprehensive spreadsheet to make auditing a snap.
- Social media audit checklist: Check off the items on this list as you perform your audit.
Table of Contents
- What Is a Social Media Audit?
- What Tools Do You Need to Run a Social Media Audit?
- Here’s a Social Media Audit Example
- Step 1: Review Your Social Profiles
- Step 2: Evaluate Your Current Performance
- Step 3: Analyze Your Social Media Content
- Step 4: Document It All in Your Template
- Step 5: Look for Opportunities in Your Findings
What Is a Social Media Audit?
A social media audit is a complete deep-dive into your social media marketing’s results. It explores your profile, performance metrics, followers and content. When you perform a social media audit, you want to answer three questions:- What’s working? What metrics and best practices do you succeed at? What kind of content works for your audience?
- What’s not working? Do you see a lack of engagement somewhere? Do you have content that doesn’t resonate with your followers?
- What can you improve? Taking the answers to the last two questions into account, what can you do to improve your social media performance?
What Tools Do You Need to Run a Social Media Audit?
You’ll need two social media audit tools: A social media calendar and an analytics platform. Many third-party platforms, like Buffer, combine social media calendar and analytics features. There are also standalone analytics platforms such as Keyhole. But, if you can’t invest in a paid social media tool yet, you still have options. You can use each social media platform’s built-in analytics features for free and manage your calendar in a spreadsheet. (Did we mention we have a template for that?) Whichever route you choose, you can use the social media audit template and checklist to track your metrics and progress.Here’s a Social Media Audit Example
Here’s an example of what a completed social media audit looks like. We filled in our social media audit template with some example data.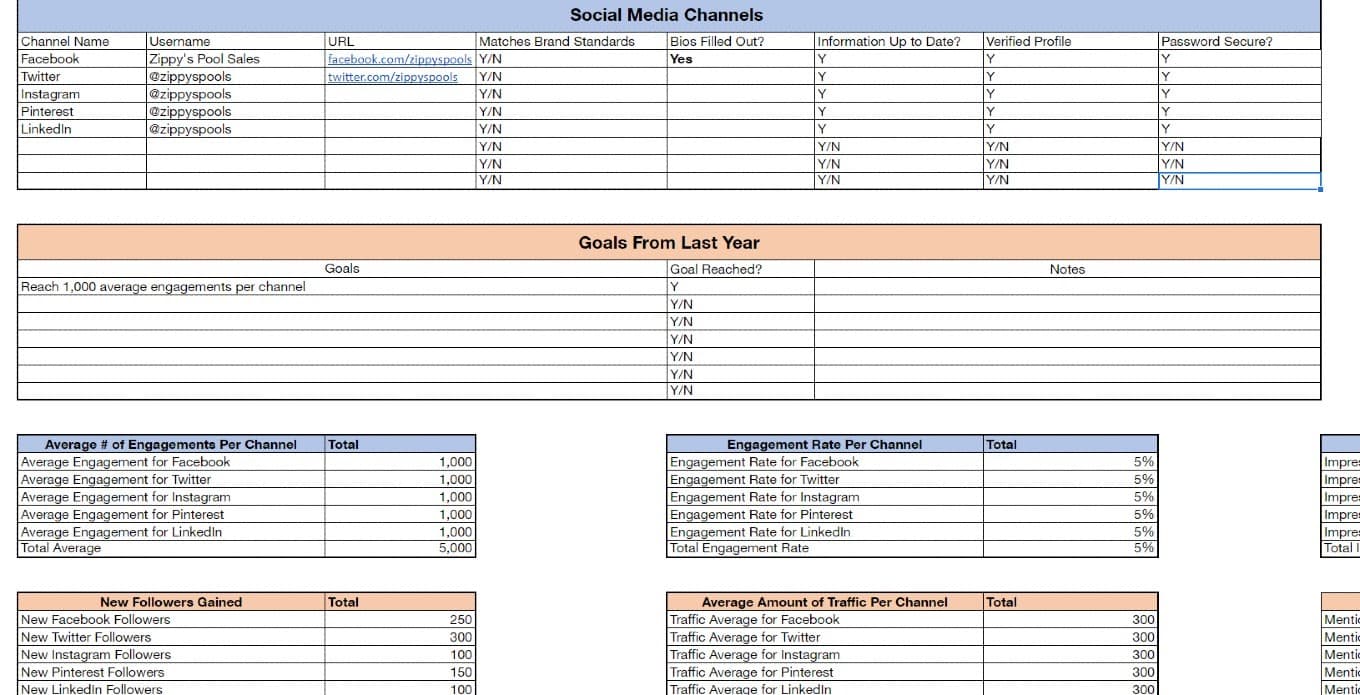 This audit overview tab includes elements like:
- A list of current social networks
- Social media marketing goals
- Average engagement across channels
- Average followers across channels
- Average traffic across channels
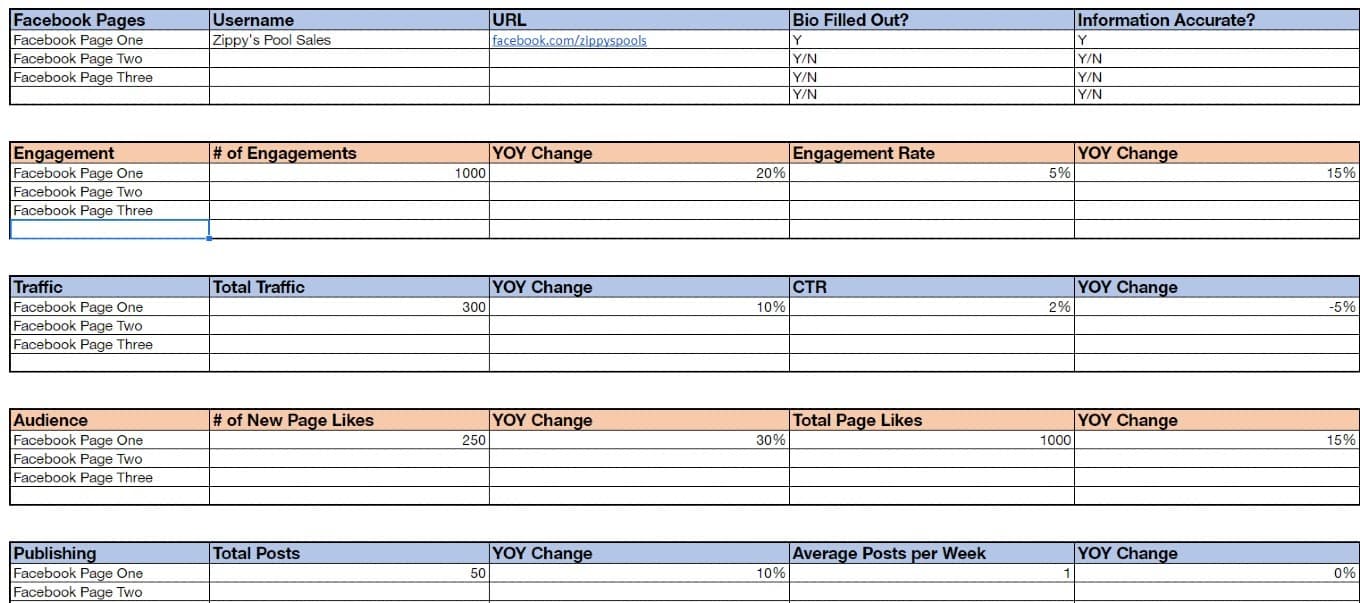 This part of the audit digs deep into each of the owner’s Facebook accounts, including the year-over-year changes in metrics.
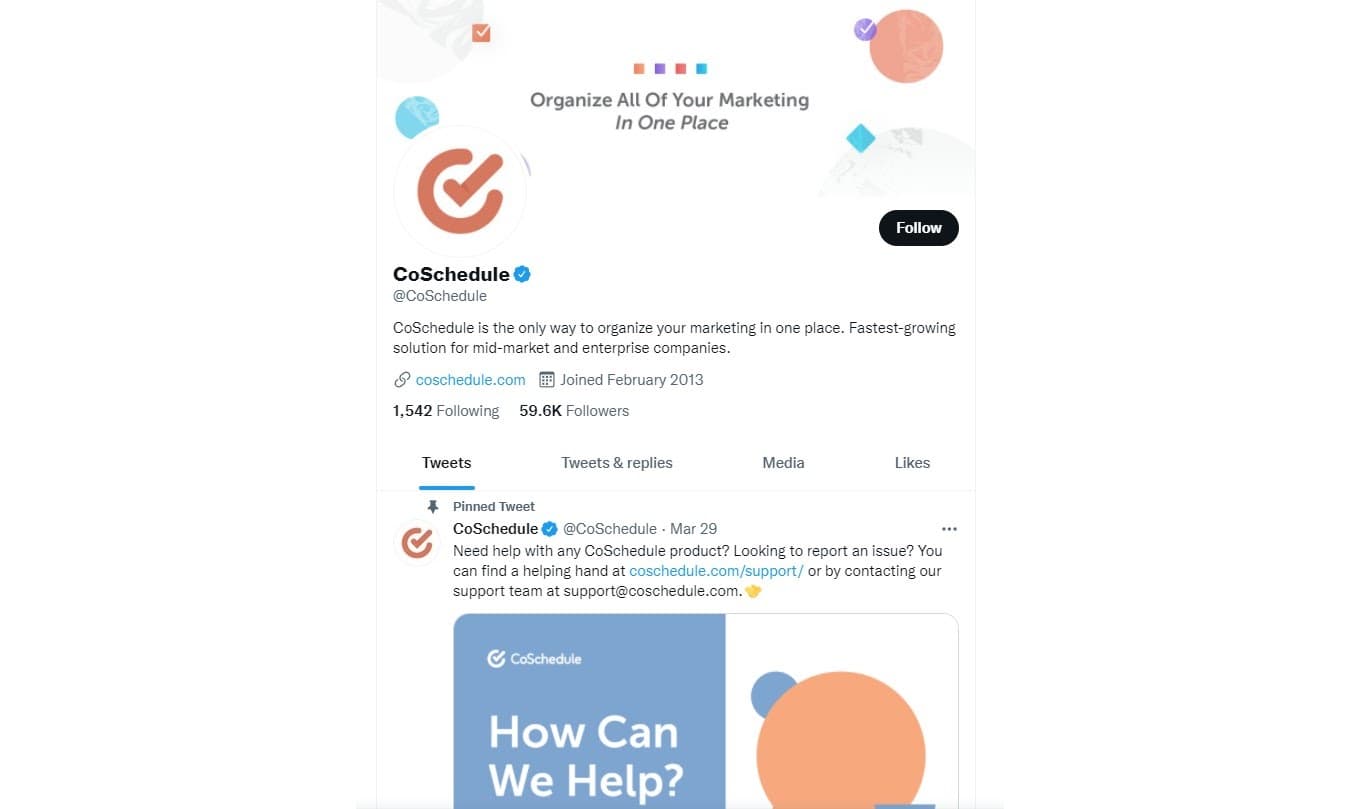
Step 1: Review Your Social Profiles
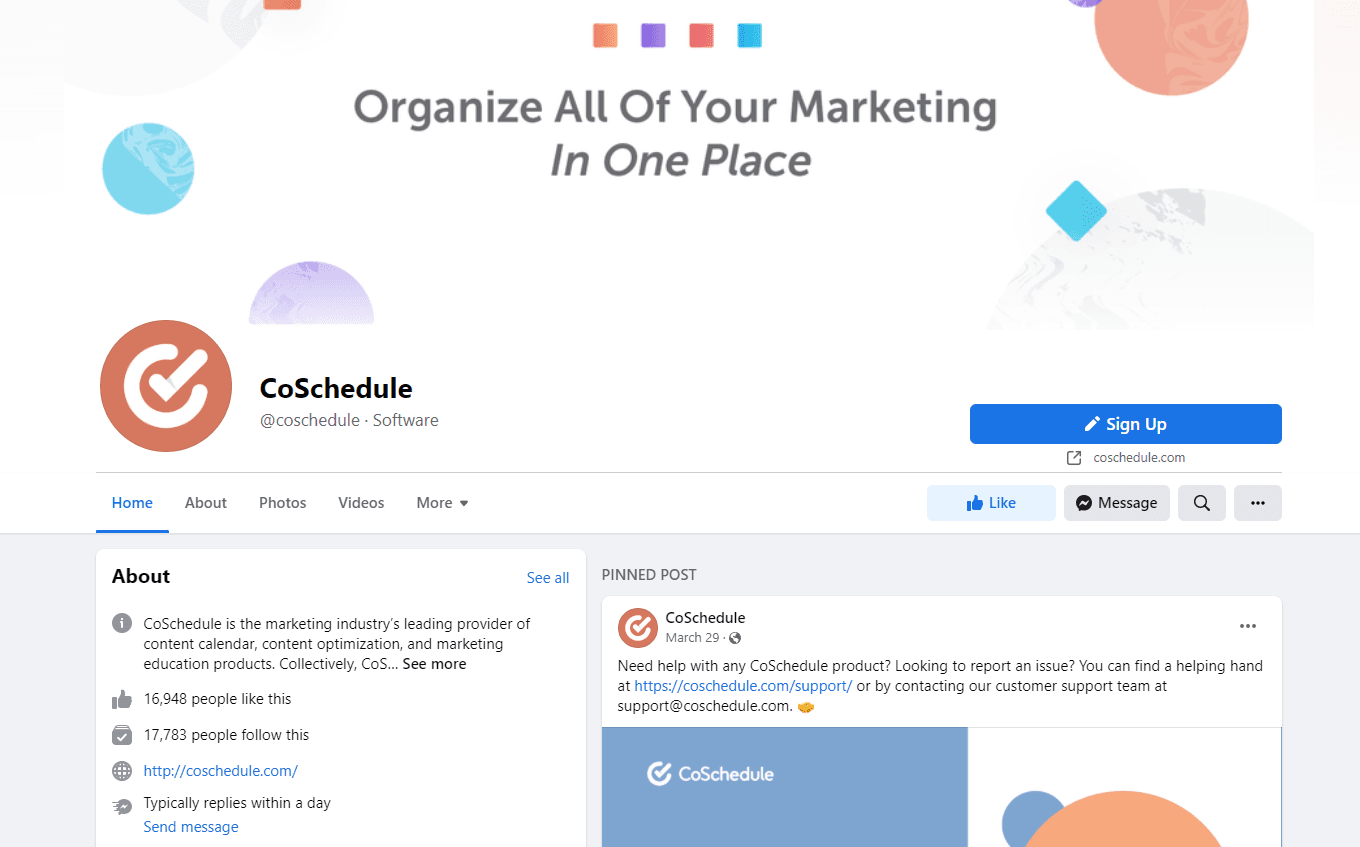
Before you explore your social media profiles’ analytics, make sure their main pages follow the best practices for their platforms. For every page, you’ll want to ask these questions:- Is the profile picture up to date and in the same style as my other brand assets?
- Is the profile bio updated and using on-brand language?
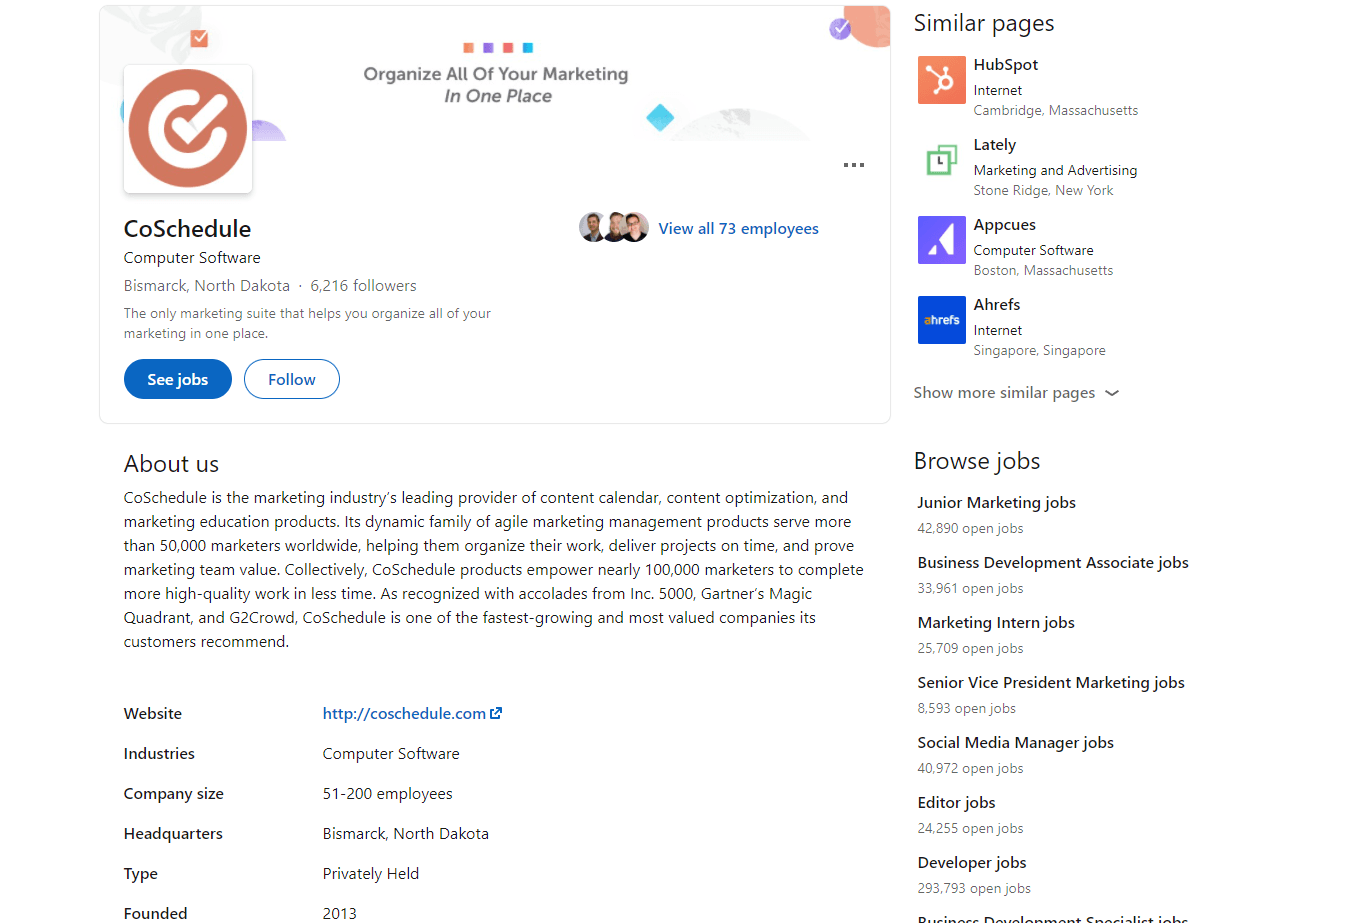
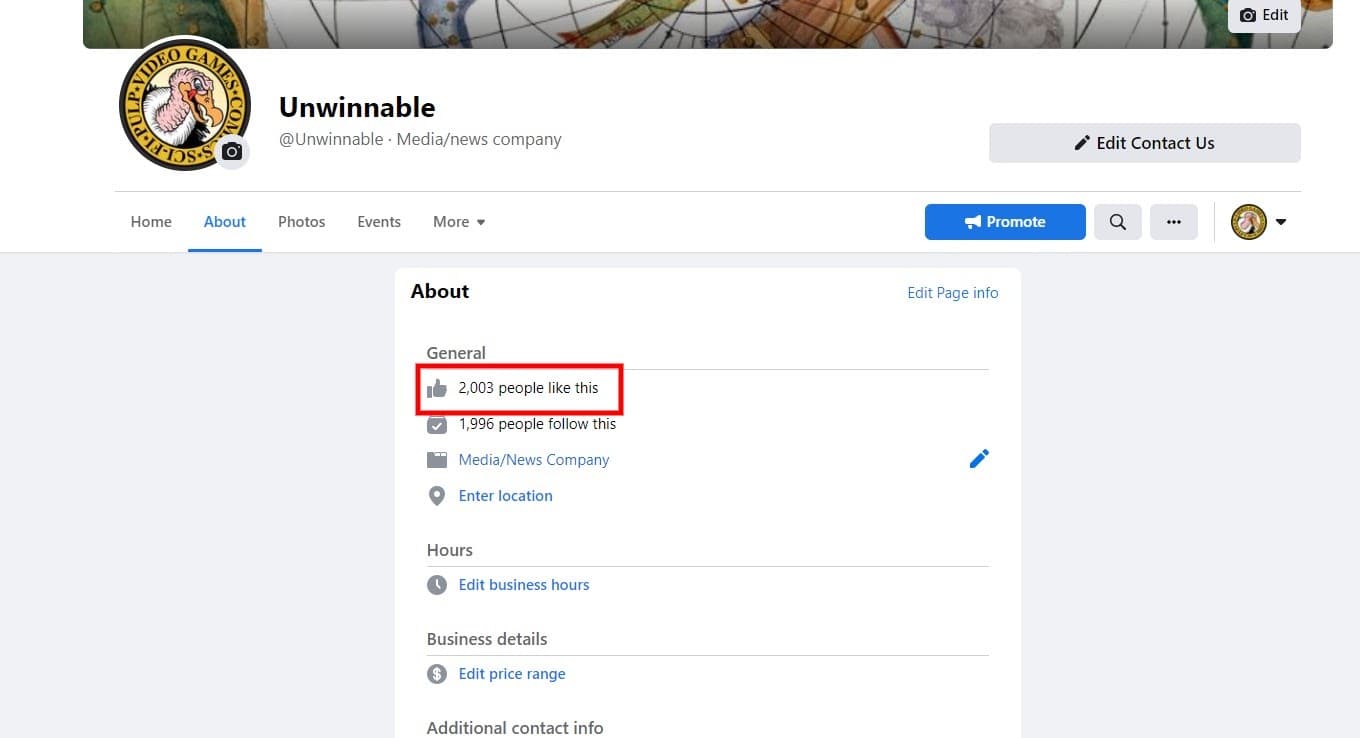
 Here’s the full About tab, too:
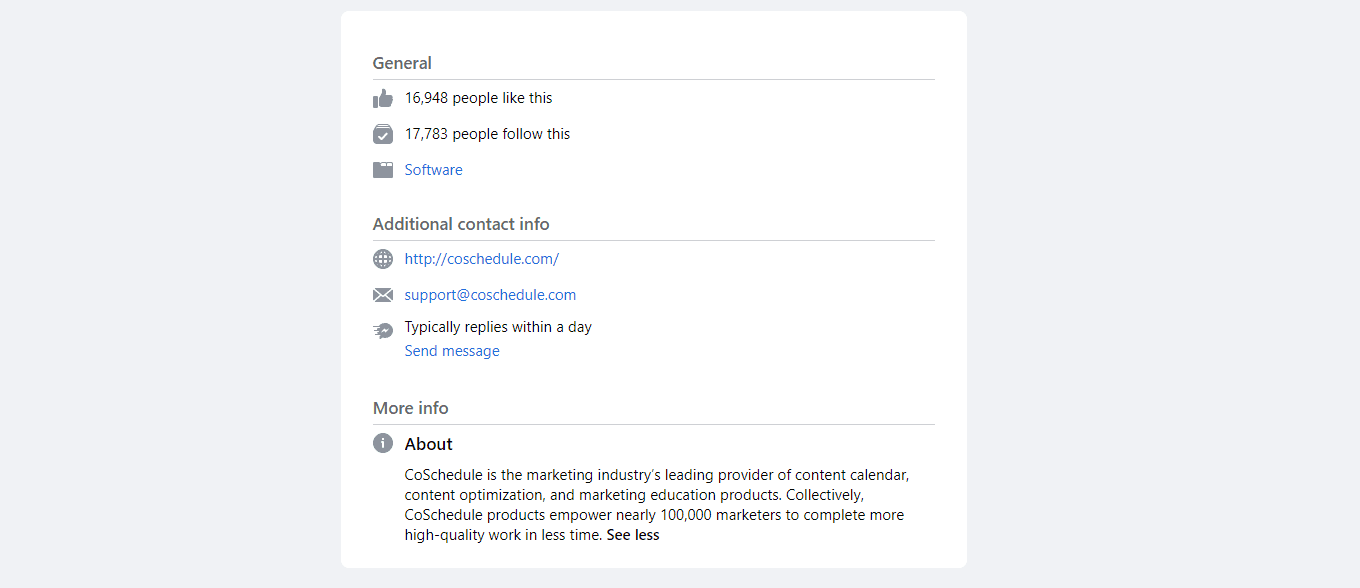 The About tab includes a website, contact info and a company description.
What can you do to build a Facebook business profile that attracts followers? Go to the Pages menu on the left side of your Facebook interface, then click on the page you want to manage. Then, make these changes using the Manage Page hub’s Home page:
The About tab includes a website, contact info and a company description.
What can you do to build a Facebook business profile that attracts followers? Go to the Pages menu on the left side of your Facebook interface, then click on the page you want to manage. Then, make these changes using the Manage Page hub’s Home page:
- Upload a square profile picture and a rectangular cover photo that match your other brand assets.
- Create a pinned post with evergreen information or a recent update using the three dots on the post you want to pin.
- Customize your page’s call to action button in the upper-right of your Manage Page hub’s Home page.
- Fill your page’s About section with a short description of your organization.
- Add your public email and phone number to your About tab.
- If you have a physical location, add your address and hours to the About tab.
- Turn on Recommendations under Page Settings > Templates and Tabs to get reviews from your followers.
 Want to fill out your own? Click the Profile option in the left menu, then go to the Edit Profile button under your profile’s header image space. Then, take these actions:
- Upload a square profile photo and rectangular header photo that fit your branding.
- Make sure your display name includes your brand name first so you’re easy to search for.
- Explain your organization in 160 characters or fewer in your bio.
- Add your location if you have a physical business.
- Fill in the Website field with your website URL.
 Get to your profile’s admin page by clicking the Me option in the top menu, then choosing your page’s name. You can then complete your profile by clicking the Edit Page button under the cover image space. Complete these tabs to fill out your profile with your most important information:
- Page info: Upload a square logo image, then make sure your organization name and URL match the names and usernames you use on your other profiles.
- Buttons: Create a custom button with your most valuable call to action, like a subscription or newsletter sign-up page.
- Overview: Write a description of your organization and add your website URL. Then, fill in details like your industry and company size.
- Locations: Add your physical locations, if applicable, so your followers can visit or contact you.
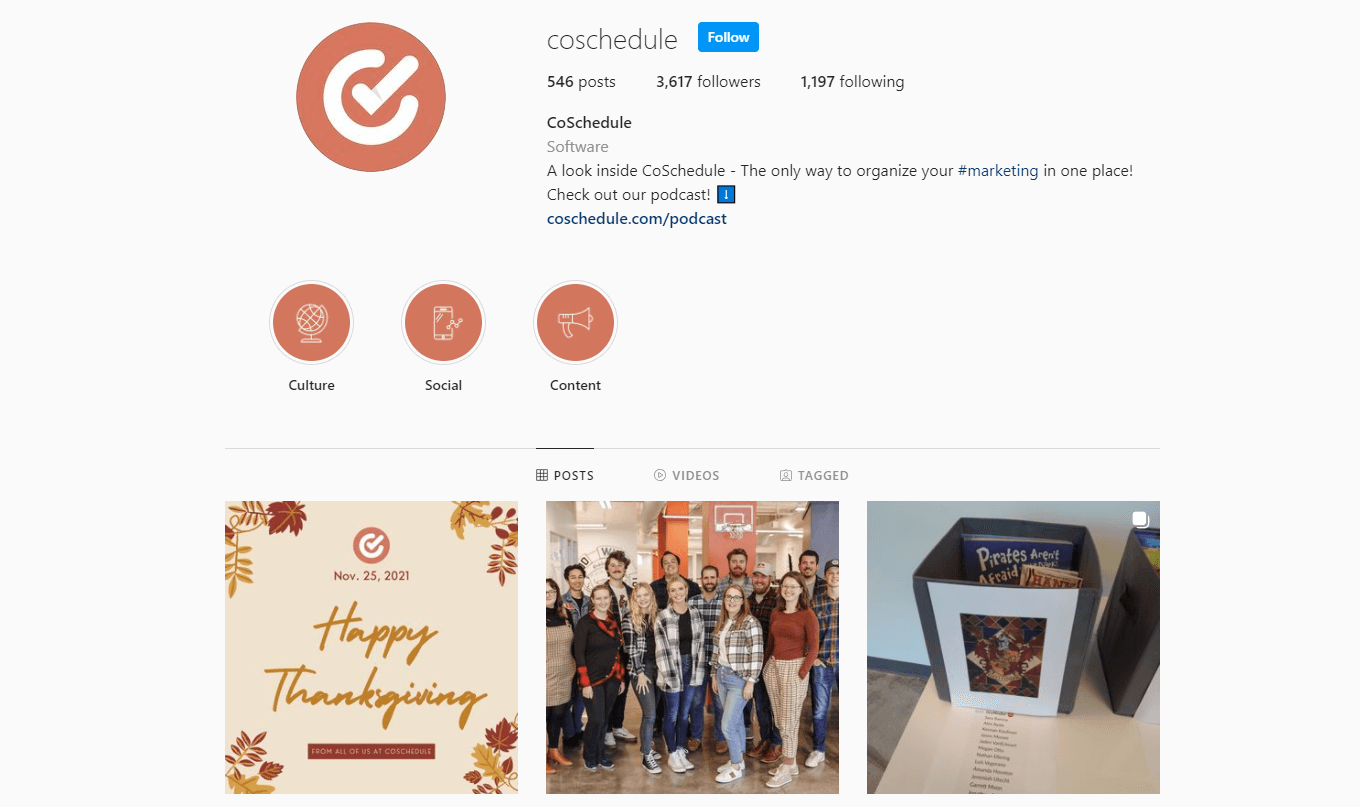 Instagram has easy-to-complete profiles like Twitter. On the web version, click on your user icon at the right end of Instagram’s top menu, then click the Edit Profile button next to your name. Complete the following sections to fill out your profile:
- Change Profile Photo: The link at the very top of this menu lets you upload an on-brand, square profile picture if you haven’t already.
- Name: Use your organization’s official name — spaces and capitalization allowed.
- Username: Check that your username matches your other social profiles’ usernames and change it if necessary.
- Website: Link to your main website or your favorite link in bio tool.
- Bio: Describe your organization in 150 characters or fewer.
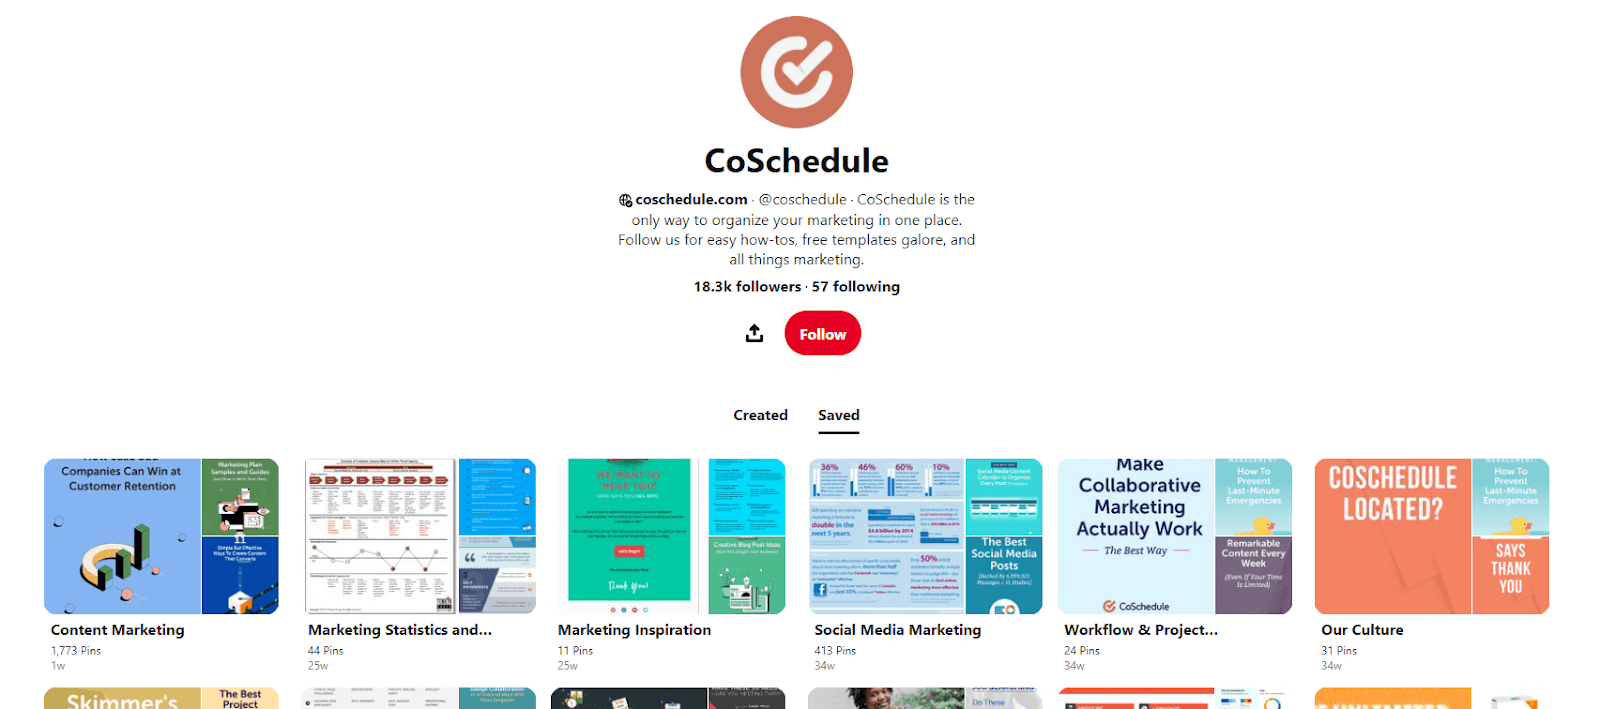 Pinterest profiles have just a few sections. Edit your profile by clicking on your profile icon, then choosing the Edit Profile button under your follower count. Make sure to:
- Upload a square profile picture that works with the rest of your brand assets.
- Check that your name matches your business name and your username is consistent with your other usernames.
- Add the URL to your website.
- Explain your organization in the About field — this description will appear at the top of your profile.
- Add a cover photo by going back to your profile and clicking the Add a Cover button near the top.
Bonus Round: Your Website
Now that your social media profiles are up to snuff, you can proudly share them on your website. Add some icons that link to your social media profiles in your header or footer. (See how CoSchedule does it by scrolling to the bottom of this page.)Step 2: Evaluate Your Current Performance
Everything on the front end of your account — your profile — looks good. Let’s explore the back end — your analytics. Record your social media metrics from the previous year in your checklist or audit spreadsheet. You’ll need them to look for trends in your statistics. The most important metrics for a social media audit include:- Followers
- Follower Growth %
- Engagement Rate
- Number of Posts
- Referral Traffic
 Then, go to Insights in the Manage Page hub’s menu to look at more Facebook analytics. Facebook will start you at Insights’ Overview page, where you’ll see the Page Summary boxes. Change their time range by clicking the period listed beside the Page Summary title.
Record your engagements for the past 28 days in the lower-left corner of the Page Summary boxes. Then, calculate your engagement rate for the year. Multiply your 28-day engagement number by 13, then divide that result by your total number of followers.
Then, go to Insights in the Manage Page hub’s menu to look at more Facebook analytics. Facebook will start you at Insights’ Overview page, where you’ll see the Page Summary boxes. Change their time range by clicking the period listed beside the Page Summary title.
Record your engagements for the past 28 days in the lower-left corner of the Page Summary boxes. Then, calculate your engagement rate for the year. Multiply your 28-day engagement number by 13, then divide that result by your total number of followers.
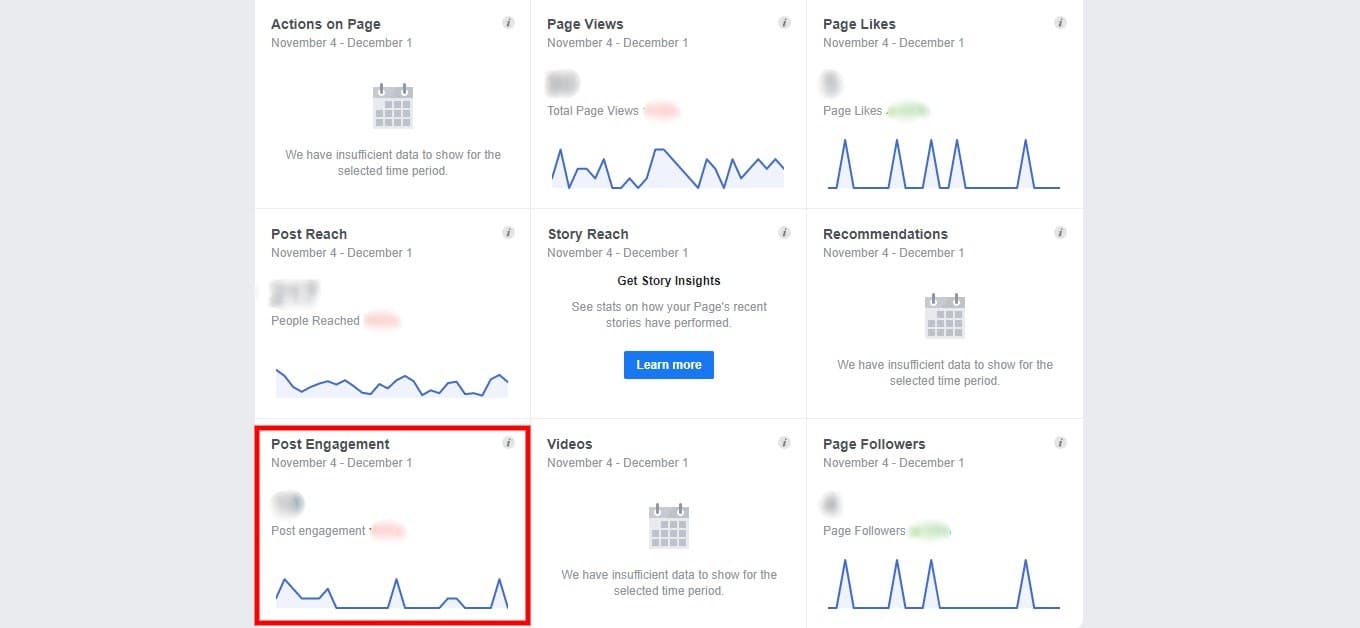 Facebook doesn’t count your posts for you, so you’ll have to count them the old-fashioned way. Go to the Posts page in Insights and count the number of posts you made in the past month under All Posts Published. Multiply that result by 12 to get an estimate for the past year.
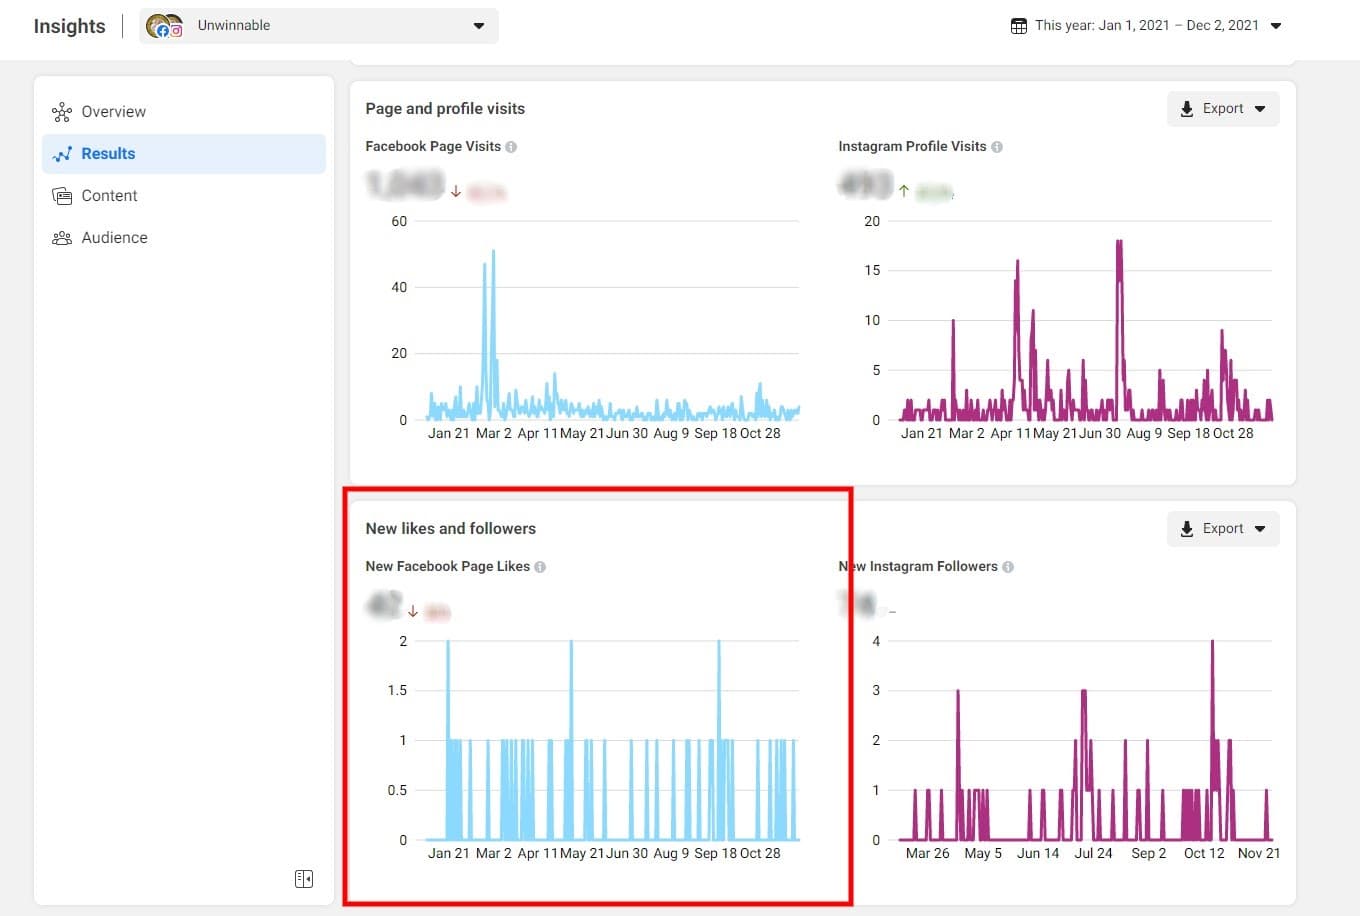
While the Page Summary boxes include your new likes for the past 28 days, there’s an easier way to calculate your total new likes for the year. Visit Facebook Business Suite through your Facebook page’s hub or by clicking a direct link, then go to the Insights page using the menu at the left end of the page.
Here, you can set the analytics period to the past year in the upper-right corner. Visit the Results page in the menu next to your analytics, then scroll to the bottom to see your new Facebook likes for the year.
Facebook doesn’t count your posts for you, so you’ll have to count them the old-fashioned way. Go to the Posts page in Insights and count the number of posts you made in the past month under All Posts Published. Multiply that result by 12 to get an estimate for the past year.
While the Page Summary boxes include your new likes for the past 28 days, there’s an easier way to calculate your total new likes for the year. Visit Facebook Business Suite through your Facebook page’s hub or by clicking a direct link, then go to the Insights page using the menu at the left end of the page.
Here, you can set the analytics period to the past year in the upper-right corner. Visit the Results page in the menu next to your analytics, then scroll to the bottom to see your new Facebook likes for the year.
 Now, calculate your follower growth rate. The process involves dividing the number of followers you gained by your starting follower count, then multiplying the result by 100.
Subtract your number of followers gained from your current number of followers to get the number of followers you had a year ago. Then, divide the number of new followers you gained in the past year by that starting number and multiply by 100.
Now, calculate your follower growth rate. The process involves dividing the number of followers you gained by your starting follower count, then multiplying the result by 100.
Subtract your number of followers gained from your current number of followers to get the number of followers you had a year ago. Then, divide the number of new followers you gained in the past year by that starting number and multiply by 100.
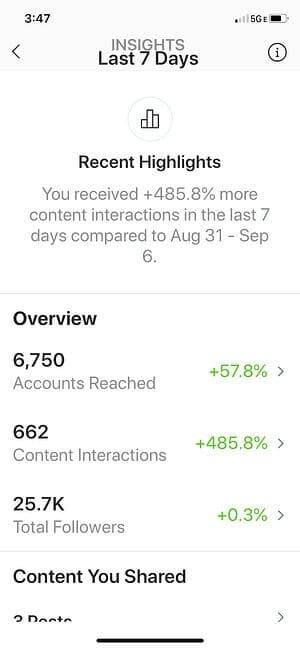 Image credit: HubSpot
For more details about Instagram Insights, check out HubSpot’s guide.
Image credit: HubSpot
For more details about Instagram Insights, check out HubSpot’s guide.
Google Analytics Referral Traffic
You have one last metric to record for your social accounts — your referral traffic. Let’s go to Google Analytics to find them. Under Acquisition on the left menu, choose Traffic Acquisition. Scroll down to the table at the bottom of the page and type “referral” in the search box above it. Now, you’ll see all of your referral traffic.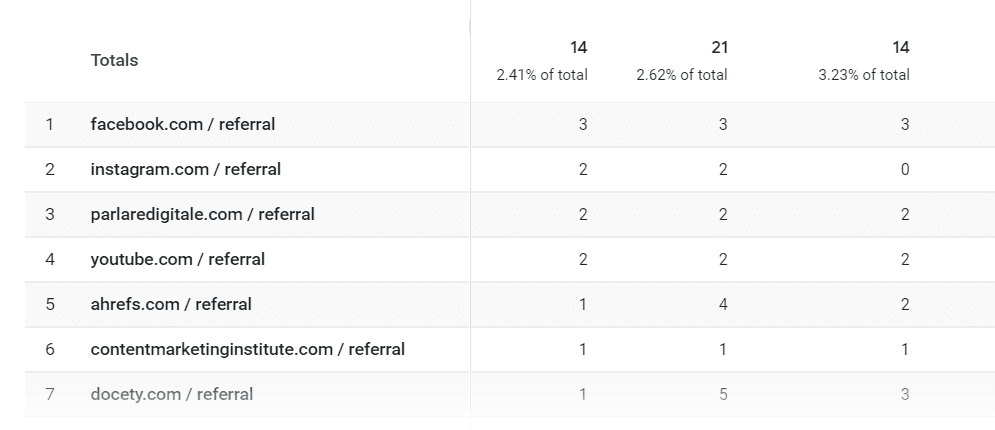 Image credit: Easy Reporting
Easy Reporting describes referral traffic in detail and how to exclude sources for easier reporting.
Image credit: Easy Reporting
Easy Reporting describes referral traffic in detail and how to exclude sources for easier reporting.
Step 3: Analyze Your Social Media Content
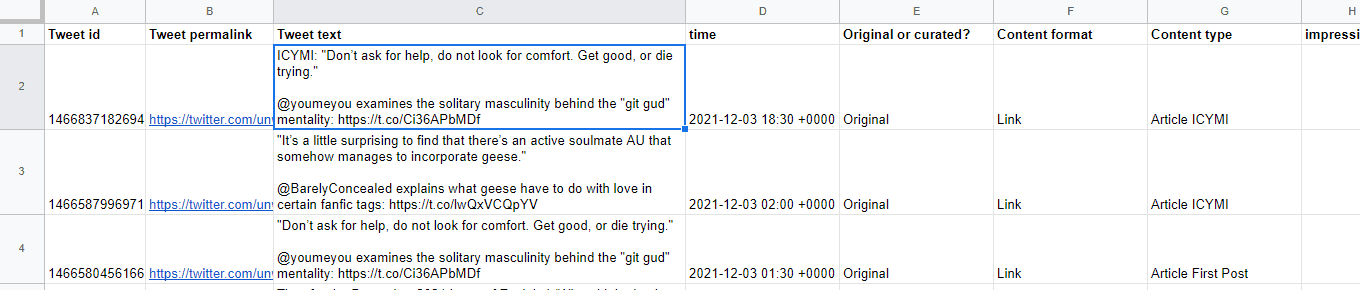
Metrics show your accounts’ overall performance, but you’ll need to look at your content to see which posts generate those numbers. Your goal for this step will be to analyze what types of content you post and how they compare. You could go through your accounts manually to see what kind of content you post, but we suggest exporting your posts and categorizing them in a spreadsheet. Start by exporting your posts through the following menus:- Facebook and Instagram: Business Suite Insights’ Content page
- Twitter: Analytics’ Tweets page
- Pinterest: Analytics’ Overview page
- LinkedIn: Analytics’ Updates page
- Original or curated?: Note whether the post shares your original content or curates content from another source.
- Content format: Categorize your post based on format, such as text, image, video, story or link.
- Content type: Record the type of content the post shares, such as a blog post, fun fact or infographic.
 Fill in those columns for every post, then ask yourself these questions:
- What post types get the most engagement? Sort your posts by engagements or engagement rate and see if any post types perform better than others.
- How often do I use each post type? Organize your posts by post type and see if you create certain types of posts more often than others. If you’re spreadsheet-savvy, you can also use the COUNTIF function.
Step 4: Document It All in Your Template
You’re on the home stretch. Let’s plug the data you gathered into your audit spreadsheet. Start with the individual profile tabs and bring it all together on the summary tab. Here are a few things to keep in mind as you fill in the template:- If you followed our steps for gathering data, you’ll have blank spots for metrics like impressions, and that’s fine. Feel free to fill in any additional metrics that you know how to find, but it’s not mandatory.
- The SWOT analysis is also optional. Follow our guide to complete it.
- Some platforms share reach numbers instead of impressions — replace impression data with reach data as needed.
- Go ahead and leave any YoY (year-over-year) sections blank if you don’t have last year’s data.
- Convert any follower growth or engagement rates that are still decimals to percentages by multiplying them by 100.
Step 5: Look for Opportunities in Your Findings
Time for the final and most important step — drawing conclusions from your data. Pull up your audit spreadsheet and content spreadsheet and ask yourself questions like:- Should I add any networks? Let’s say you only have Facebook and Twitter, but you notice that professional tips perform well. You could benefit from starting a LinkedIn account.
- Should I remove any networks? If you notice a network not performing well, it might not be a good fit for your audience. Consider whether the low performance comes from a lack of posts or low customer interest.
- What content types should I focus on? Do you see certain types of content outperforming others? Think of ways to focus more on that content and create spin-off content categories.
- What content types can I improve on? Notice any content types underperforming? Brainstorm how to improve them or look for content types to replace them with.
- Should I set new social media goals going forward? Considering your answers to the previous questions, should you set new social media goals to pursue an opportunity?


