How To Prove Your Organic Social Media ROI With Google Analytics

 Social media is an essential part of any marketing mix.
But, what happens when your boss or client asks you to prove organic ROI for your campaigns?
“I don’t know" is not a good enough answer.
In fact, “I don’t know” should not be in the vocabulary of your social media team.
Fortunately, you can prove your ROI with some hard work and the right tools. And by the right tools, I mean Google Analytics and CoSchedule.
The following blog post is going to walk you through how to:
Social media is an essential part of any marketing mix.
But, what happens when your boss or client asks you to prove organic ROI for your campaigns?
“I don’t know" is not a good enough answer.
In fact, “I don’t know” should not be in the vocabulary of your social media team.
Fortunately, you can prove your ROI with some hard work and the right tools. And by the right tools, I mean Google Analytics and CoSchedule.
The following blog post is going to walk you through how to:
- Set up tracking UTM tags on your social media messages.
- Create a custom report in Google Analytics.
- Set goals in Google Analytics to track your ROI.
How To Prove Your Organic Social Media ROI With Google Analytics
Click To TweetFirst Things First: Get Your Social Media ROI Report Template
Before you continue reading, download our social media channel ROI report template. It'll help you track everything you need to prove to your organization that social media marketing is paying off (and show that you're earning your paycheck).Did You Know…
CoSchedule can save you time with our Google Analytics and bit.ly integrations by doing all the hard work for you. CoSchedule automatically creates trackable URLs that integrate with your Google Analytics custom reports. Get started free or schedule a demo today and try it yourself.
Why Is Tracking Organic Social Media ROI Important?
Your bottom line is the heart and soul of your business. It’s what keeps the doors open and the lights on. Tracking your ROI helps prove to your organization and your clients that investing their dollars in social media campaigns is contributing to that bottom line. It proves beyond a shadow of a doubt that your efforts are worth both your time and your company’s time. Because if your team is investing their precious time in something you can’t prove is working, that’s just a waste of resources. And nobody wants that.If you can't prove your social media marketing is working, then you're just wasting resources.
Click To TweetStep 1: Goal Setting In Google Analytics
Setting up goals is going to be your first step in using Google Analytics to track your organic ROI. Goals are a way to have Google Analytics record conversions that are being generated from social media. What are conversions? Conversions are an event that is triggered by a customer, audience member or fan following through with an action that you wanted them to take. Conversions can be anything from:- Buying a product
- Signing up for an email list
- Subscribing to your podcast
- Downloading an e-book you wrote
 Scroll across to Views:
 Select Goals and then click on Create New Goal:
 In the new window, name your goal. Be specific and try to remember as you’ll need to search for this name later:
 Next, you’re going to select your goal type. There are three different goal types in Google Analytics:
For this example, we’re going to focus on custom goals (destination, duration, pages/screens per session and events):
Next, you’re going to select your goal type. There are three different goal types in Google Analytics:
For this example, we’re going to focus on custom goals (destination, duration, pages/screens per session and events):
 Click Continue and another drop down menu will appear. In this section, you’re going to put in the URL of the landing page that you want your customers to end up on.
For example, say that after purchasing a product a thank you landing page appears. If that landing page surfaces it means someone bought something from you. Therefore a conversion that you need Google Analytics to track has happened:
Click Continue and another drop down menu will appear. In this section, you’re going to put in the URL of the landing page that you want your customers to end up on.
For example, say that after purchasing a product a thank you landing page appears. If that landing page surfaces it means someone bought something from you. Therefore a conversion that you need Google Analytics to track has happened:
 Under Value, toggle the button to On and enter the monetary value that your company will earn if that conversion happens:
 Click Save and your destination goal will be tracked.
Step 2: Create Your Custom Report
The next step in your social media ROI tracking process involves creating a custom report in Google Analytics that will allow you to easily find and track data coming in from the goals you set up earlier. To start, go back to your home screen and select Customization: Select Custom Reports:
 Select New Custom Report:
 Your new report template will appear, and the first thing you need to do is title it:
 The next step is to add your metrics. First, click +add metric. Then select Goal Conversions:
 Then find your goal and select the one that says [title of your goal] completions. You need to make sure that it says completions as you’ll want to know how many people went all the way through and converted:
 The second metric you need to add is the value. Adding only one will give you only half of the metrics you need to see. And the value you’re getting from each conversion is the important part! To add it into your report, select Goal Conversions, then [goal title] value:
 Now you need to add your dimension drilldowns. First click + Add Dimension, the search for Source:
 From source, add your second dimension which should be Medium:
 Your final dimension should be Campaign:
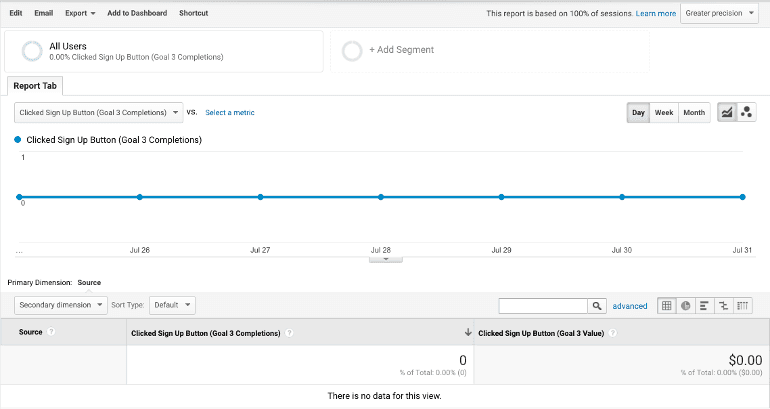
 Your report should populate and show you all the conversions and the value that you made through people ending on your intended link:
Step 3: Set Up Your Custom URL Tags
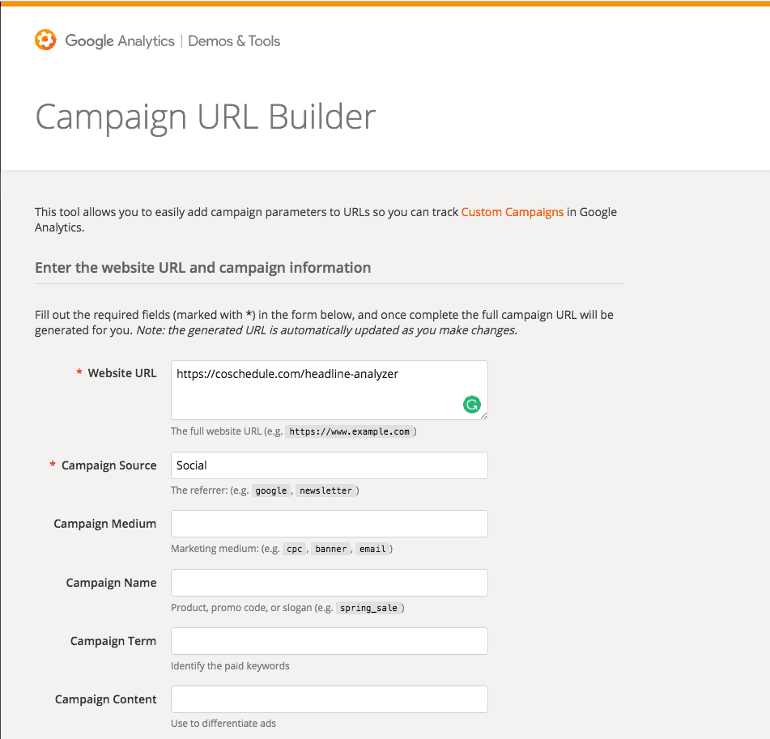
The final step in your process is setting up your URL tags for each of your social media messages. These URL links allow Google Analytics to track where your audience is coming from once they have completed the assigned conversion. To get started, open this campaign URL builder from Google Analytics: The second thing you need to do is enter the URL your Google goal is tracking:
 Next, you need to fill in your campaign Source. This is a vital part of your URL because if you scroll back up to the custom report section, source is part of your drilldown dimensions:
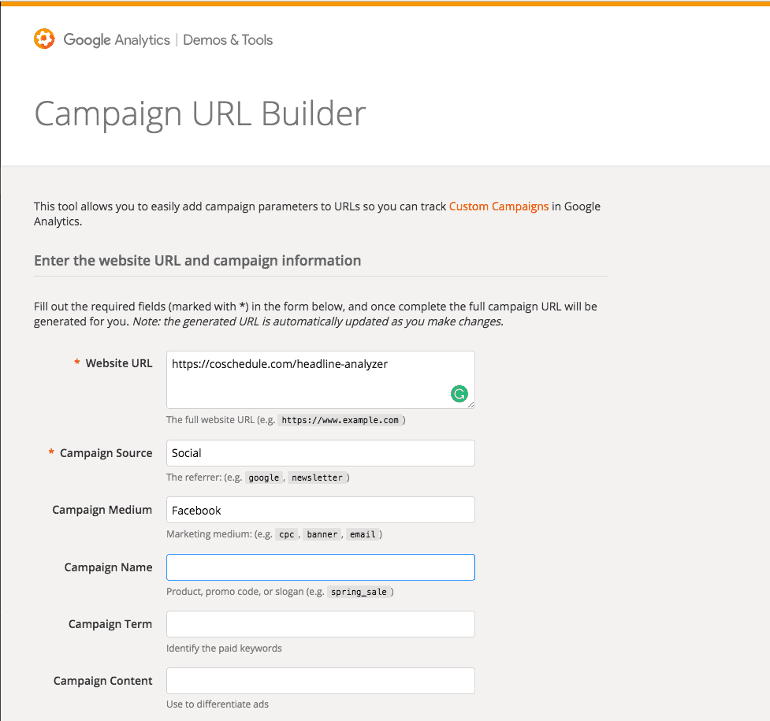
 Campaign Medium is the next part of your URL building process and is going to refer to the social channel that your audience is coming from:
 Campaign Name refers to the keywords that you want this link to rank for in Google Analytics:
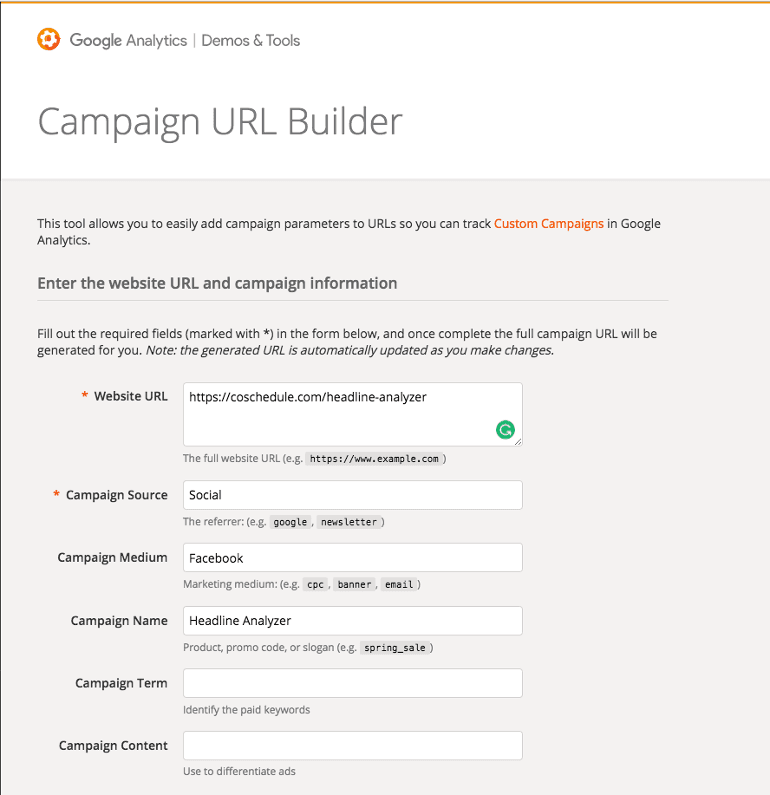 Campaign Term is used for paid search, and since we’re focusing on organic content, it won’t need to be filled in for this example.
Campaign Content is used for A/B testing targeted ads which are also outside our focus for this post.
After you have all of that information filled in Google will generate a URL at the bottom of the page.
Campaign Term is used for paid search, and since we’re focusing on organic content, it won’t need to be filled in for this example.
Campaign Content is used for A/B testing targeted ads which are also outside our focus for this post.
After you have all of that information filled in Google will generate a URL at the bottom of the page.
 That URL seems long right?
That’s where URL shortener like bit.ly come in handy.
To use bit.ly you need to create an account. Once you’re logged in, you’ll see their main page:
That URL seems long right?
That’s where URL shortener like bit.ly come in handy.
To use bit.ly you need to create an account. Once you’re logged in, you’ll see their main page:
 Paste your link into the bar and copy the shortened URL link:
 The shortened URL can now be added to your social media messages and tracked by Google Analytics.
Step 4: Record Your Results
The last step in your ROI tracking process is going to be looking at your report and recording your results after your social media campaign has ended. The first thing you need to do is adjust the time and date on your custom report to reflect the length of your campaign. This can be found in the upper right-hand corner.- Total conversions generated
- Total ROI generated
- Breakdown of ROI generated per channel
- Breakdown of conversions generated per channel
Recommended Reading: How to Build a Marketing Report Quickly (Free Template)
Remember The Report You Downloaded Earlier?
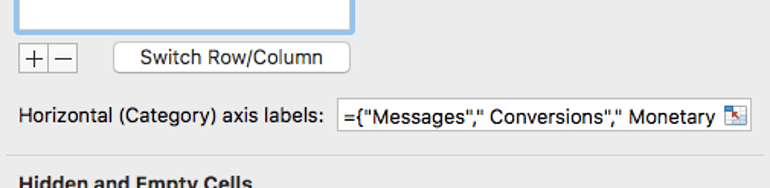
Let’s run through that quick. Your social media channel ROI report will allow you to pull the information that you’ve grabbed from Google Analytics and create a robust breakdown of what’s happening on each of your social media channels. In the report you’re going to see a tab for each social channel: The next three columns are going to play a major role in your report. Did you notice the graphs on the left side of your report. These are recording and collecting data based on your messages sent, conversions and ROI.
The first graph is gathering data from your total at the bottom of your spreadsheet:
The next three columns are going to play a major role in your report. Did you notice the graphs on the left side of your report. These are recording and collecting data based on your messages sent, conversions and ROI.
The first graph is gathering data from your total at the bottom of your spreadsheet:
 As you continue to add numbers for each on of your campaigns, they will adjust and automatically update your graphs.
The second graph is a per channel breakdown of each of your campaigns. To edit this chart and add more information your need to click on the graph and then select Chart Design and Select Data:
As you continue to add numbers for each on of your campaigns, they will adjust and automatically update your graphs.
The second graph is a per channel breakdown of each of your campaigns. To edit this chart and add more information your need to click on the graph and then select Chart Design and Select Data:
 A pop-up window will appear. You need to change the data range by adding the next column of information that you just plugged into the spreadsheet. You can do this by highlighting the new range of data you would like to include:
 Then you need to rename each campaign that you added to your graph:
 You will also need to update the Horizontal Axis labels in the bottom of the pop-up window:
Now For A Short Cut
Building all those URLs kind of sounds like a time suck right? Granted, it’s a time suck that’s worth it, but what if I told you that CoSchedule has built-in integrations that work with both Google Analytics and Bit.ly so that all you need to do is set up your goals and custom report in Google? To start you need to turn on both the bit.ly and the Google Analytics integrations. To do this go to Settings and then Integrations: Now that the integrations are turned on Google Analytics will begin to gather data from every social media message you send.
To find that data collection, open your analytics account select Acquisition then Campaigns. In campaigns click on CoSchedule to see a full breakdown of your post analytics.
Now that the integrations are turned on Google Analytics will begin to gather data from every social media message you send.
To find that data collection, open your analytics account select Acquisition then Campaigns. In campaigns click on CoSchedule to see a full breakdown of your post analytics.
Here's how to prove #social #media #ROI with #Google #Analytics and @CoSchedule:
Click To Tweet


