How to Perform a Content Audit in 15 Minutes With a Template

 Do you know how well your content is performing on a macro and micro level? You should. Otherwise, campaigns are a shot in the dark. Both individual pieces of content and entire campaigns need to be analyzed to find optimizations and errors.
If not, you may have trouble on your hands. This is because publishing content without auditing it later is a surefire way to miss opportunities while wasting time and budget.
I can’t blame you, though. It seems daunting, doesn’t it? This amplifies when you have hundreds to thousands of pieces of content or more published. How do you audit all of that? Wouldn’t it take weeks?
Not at all. The exact opposite. In fact, you can audit your website’s content in as little as 15 minutes. Want to see how? Keep reading.
Do you know how well your content is performing on a macro and micro level? You should. Otherwise, campaigns are a shot in the dark. Both individual pieces of content and entire campaigns need to be analyzed to find optimizations and errors.
If not, you may have trouble on your hands. This is because publishing content without auditing it later is a surefire way to miss opportunities while wasting time and budget.
I can’t blame you, though. It seems daunting, doesn’t it? This amplifies when you have hundreds to thousands of pieces of content or more published. How do you audit all of that? Wouldn’t it take weeks?
Not at all. The exact opposite. In fact, you can audit your website’s content in as little as 15 minutes. Want to see how? Keep reading.
How to Perform a Content Audit in 15 Minutes with a Template
Click To TweetFirst, Download Your Content Audit Template
In order to conduct your audit, you'll need to store your data in a spreadsheet. You can use this template to make this task simple:What is a Content Audit?
A content audit dissects a company’s content and its overall performance. It looks at all of their individual metrics, channels, and content to mainly determine two factors: what’s working and what isn’t? This positions a business to create more content that is generating engagement and dial back what’s collecting dust.
Content audits can also be done completely for free. You don’t need expensive suites or tools, although they will help. I’ll be showing you how to conduct an audit in 15 minutes with completely free assets.
This positions a business to create more content that is generating engagement and dial back what’s collecting dust.
Content audits can also be done completely for free. You don’t need expensive suites or tools, although they will help. I’ll be showing you how to conduct an audit in 15 minutes with completely free assets.
Content audits can be done for free!
Click To TweetStep 1: Create a List of Your Content Assets
The first step is to organize a list of all of your website’s content. While you could put in the elbow grease to do this manually, I highly recommend that you save time and energy by using a free tool like Screaming Frog. This extractor tool will analyze your website to find all of its content, metrics, and data. You can download it here. Begin by entering a URL into the search bar and hitting the “Analyze” button. Give this a few minutes. Next, filter by “HTML” and click the export button beside the dropdown menu to download the results as a CSV. We want to audit pages and not other information that will cause clutter.
 Upload the file to Google drive and it will look like this:
 I know it looks confusing, but I’ll clarify everything later.
Step 2: Pull Google Analytics Data
You use Google Analytics, right? Most marketers do, thus it plays an integral role in content audits. However, you can find similar (if not the same or more) in other analytics tools if that’s what your company uses. For this tutorial, however, we’ll be using Google Analytics because it’s free and popular. After it’s integrated to your website and collected data, there is no shortage of information about content you will have access to. It also can be exported to be analyzed during your content audit process. There are a few primary reports that you need to export, including:- Acquisition
- Page content
- Goals
 Click the “Export” button at the top of the page and choose the Google Sheets option to automatically make a file on Google Drive.
Then, head over to “Behavior” and “All Pages” under “Site Content”.
Click the “Export” button at the top of the page and choose the Google Sheets option to automatically make a file on Google Drive.
Then, head over to “Behavior” and “All Pages” under “Site Content”.
 This tracks all of the pages on your website along with their performance metrics. (More on those later.)
Perform the same steps as before to export the data to a Google Sheets file.
This tracks all of the pages on your website along with their performance metrics. (More on those later.)
Perform the same steps as before to export the data to a Google Sheets file.
Recommended Reading: How to Complete a Social Media Audit in Nine Steps (+ Free Template)
Lastly, click the “Conversions,” “Goals,” and “Overview” tabs.
 This shows all of your goals and performance data. Export this as a spreadsheet and move onto the next step.
Step 3: Pull Google Search Console Data
Google Search Console is a crucial tool for content marketers as it tracks search data including click-through rates, rankings, and keyword positions.Google Search Console is a crucial tool for content marketers as it tracks search data including click-through rates, rankings, and keyword positions.
Click To Tweet Click the export button on the top of the page and choose the CSV option.
Step 4: Measure KPIs and Fix Issues
At this point, you’ve successfully collected all of your website’s content data and neatly organized it into spreadsheets. But, you’re probably thinking “What do I do with all of this data?” and that’s next. Keep in mind that every business has different KPIs so you may have to tailor the content auditing process to your unique metrics. However, these are some which are universal:Auditing Metadata with Screaming Frog
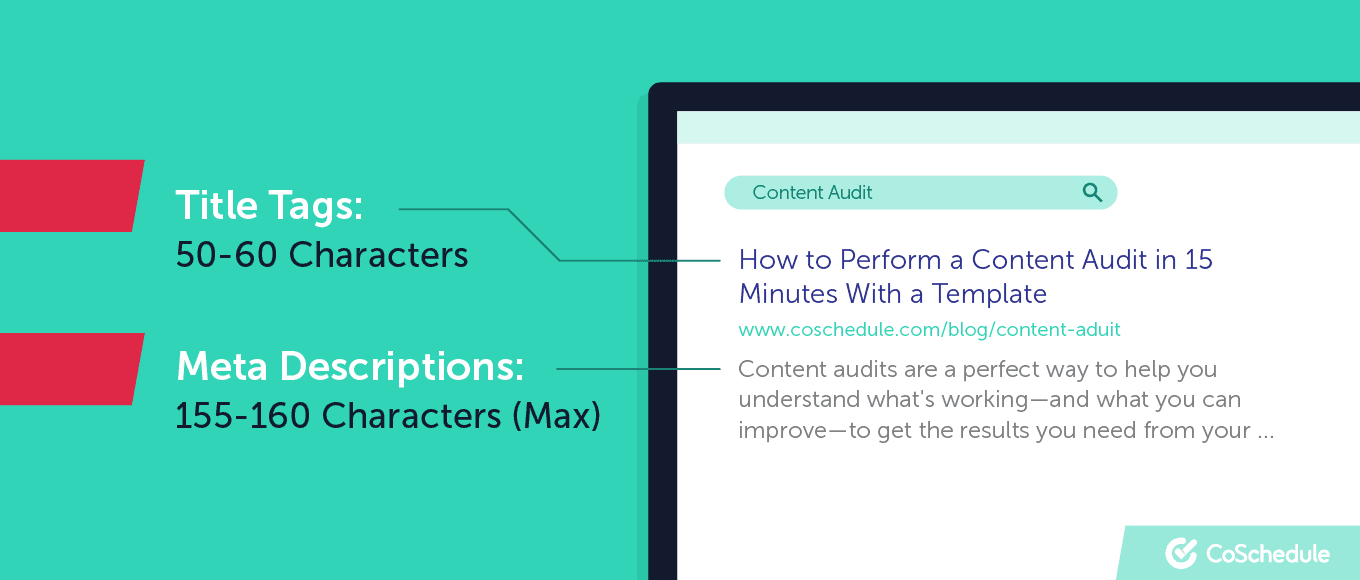
Let’s begin with the Screaming Frog crawl you performed. In particular, let’s start by auditing title tags and meta descriptions. These can be found under their appropriate column. Make sure there are title tags and meta descriptions to begin as these are needed for SEO and user experience purposes. Similarly, title tags should be 50-60 characters and meta descriptions should be 155-160 characters long for readability.
 Next, pay close attention to error codes.
- 200 = good.
- 404 = bad.
 Fix any errors that you find in this step of the content audit. You can then begin looking at Google Analytics and Google Search Console data next.
Website Traffic
Let’s look at one of the most popular marketing KPIs there is: traffic. After all, if you’re not receiving any traffic, then you won’t be generating conversions, subscribers, etc.If you're not receiving any traffic, then you won't be generating conversions, subscribers, etc.
Click To Tweet This will display all of the traffic your website has generated in a specific period along with each source.
Recommended Reading: How to Improve Your Content With a Content Audit Template
Use this information to determine if your traffic is increasing or decreasing and what sources generate the most.
Are there any channels that don't look to be picking up momentum? Consider dialing those back while investing more in the platforms acquiring more users.
Bounce Rate
The bounce rate is the number of users who visit a page and leave without navigating to any others. Don’t fret if it’s high. It depends on your next niche and business. Nonetheless, consider that the average bounce rate is between 70-90%. It makes sense, too.
Users search for a topic, read an article, and move on. They may not necessarily be interested in continually reading, but just solving their question.
You can improve the bounce rate of pages by first adding more internal links. This will keep users on your website for longer.
Nonetheless, consider that the average bounce rate is between 70-90%. It makes sense, too.
Users search for a topic, read an article, and move on. They may not necessarily be interested in continually reading, but just solving their question.
You can improve the bounce rate of pages by first adding more internal links. This will keep users on your website for longer.
You can improve the bounce rate of pages by first adding more internal links.
Click To TweetAverage Top on Page
A similar metric to bounce rate you can find through Google Analytics is average time on page. This, as you could guess, is how long users spend on a page. You can find this number under the behavior report you exported. A good benchmark is between two and three minutes. It’s a direct signal to Google if the content on a webpage is high quality and relevant. After all, if a user stays for long periods, the page is clearly in-depth and worth reading. One of the best things you can do to increase the average time users spend on a page is increasing its length and utility. Long-form content provides more resources and information for readers to consume, naturally keeping them on a page for longer. Similarly, providing tools and step-by-step instructions increases how long they will engage with a piece of content.Backlinks
Links are like a voting system. Remember the reality TV show Survivor? People got voted off the island and the winners stayed. Search engines are the opposite.Recommended Reading: How to Create Content Hubs to Cover Competitive Topics
The more votes, the better. This is especially the case because quality backlinks remain as one of Google’s primary ranking factors.
 Source: https://backlinko.com/
That’s precisely why you need to audit how many links you’re receiving, their effectiveness, and where they refer from.
This information helps you determine if link campaigns are working and which links carry the most weight.
I recommend using a free tool like SEMrush to inspect your backlink profile.
Source: https://backlinko.com/
That’s precisely why you need to audit how many links you’re receiving, their effectiveness, and where they refer from.
This information helps you determine if link campaigns are working and which links carry the most weight.
I recommend using a free tool like SEMrush to inspect your backlink profile.
I recommend using a free tool like SEMrush to inspect your backlink profile.
Click To Tweet Next, scroll down and click the backlinks.
 Here you will see which links your website is receiving, from who, and the weight they carry.
Have you been hitting backlink campaign goals? Are keyword rankings improving? Is your authority improving?
Use this data to determine which types of backlinks and strategies are moving the needle.
Here you will see which links your website is receiving, from who, and the weight they carry.
Have you been hitting backlink campaign goals? Are keyword rankings improving? Is your authority improving?
Use this data to determine which types of backlinks and strategies are moving the needle.
SERP Click-Through
You can rank highly on Google. That’s great. But, it’s not the end-all-be-all silver bullet some SEO’s think it is. This is why you need to audit your click-through rate. This is the number of impressions a keyword receives divided by its clicks. You can see the click-through rate of individual pages by visiting the Google Search Console data you downloaded. Keep in mind that the average first result on Google has a 31.7% CTR, so use that as a benchmark.
 One way to optimize organic click-through is by split testing the copy for title tags and meta descriptions since that’s what users mainly see.
Title tags, which are headlines, should be exciting, unique, and highly relevant to the users.
One way to optimize organic click-through is by split testing the copy for title tags and meta descriptions since that’s what users mainly see.
Title tags, which are headlines, should be exciting, unique, and highly relevant to the users.
Recommended Reading: Content Governance: How to Establish Processes That Drive Great Content
Similarly, the meta description should use your main keyword as it becomes bold like this:
 I also recommend answering the following questions in the meta description and title tag:
- Why should the reader click through?
- What will they learn?
- What makes your content different?
Conversions
Last but not least, conversions. This is perhaps the most important metric to audit because one of the main purposes of content is to achieve other goals like subscribers or sales. If it’s not doing anything, that’s a problem that needs to be addressed. But, conversions aren’t cut and dry. There are subscribers, sales, contact forms, downloads, and other forms of conversions. Additionally, consider for a moment that the average conversion rate for a landing page is 2.35%. Analyze how well your organization is completing goals in Google Analytics. Brainstorm strategies for improving lagging goals and how to replicate successful ones.


