How To Write A Report: A Simple Step-By-Step Process

 Knowing how to write a report is an essential skill that every marketer who wants to stay competitive and employed must learn.
Even if the strategies you've deployed recently are clearly paying off, chances are your bosses are not going to be content with just knowing your marketing efforts are successful.
They will still need to see a report that shows exactly what you're doing, which experiments are paying off, and which ideas fell flat on their face.
So how do you go about writing this report? Where do you start? What should you include in it? How do you structure each section?
In this article, I'm going to share with you my step-by-step approach to writing effective and well-thought-out reports that will impress readers every time.
Knowing how to write a report is an essential skill that every marketer who wants to stay competitive and employed must learn.
Even if the strategies you've deployed recently are clearly paying off, chances are your bosses are not going to be content with just knowing your marketing efforts are successful.
They will still need to see a report that shows exactly what you're doing, which experiments are paying off, and which ideas fell flat on their face.
So how do you go about writing this report? Where do you start? What should you include in it? How do you structure each section?
In this article, I'm going to share with you my step-by-step approach to writing effective and well-thought-out reports that will impress readers every time.
The Importance Of Marketing Reports
What Is A Report?
A report is a formal document that provides an in-depth analysis of an ongoing or completed research, initiative, project, or campaign that pertains to your work. The point of a report is to evaluate the progress you've made, take note of the issues or obstacles that impacted your results, and draw conclusions to inform future decisions. There are different types of reports you may be required to create depending on the aspect of marketing that you specialize in. They include:- Social media marketing reports
- Email marketing reports
- Content marketing reports
- PPC marketing reports
- General marketing reports
Why You Need To Write Reports
What is the point of spending time figuring out how to write a report when you could be directing that energy toward trying to attract, engage, convert, and delight customers? This is a question that almost every marketer who has had to write a report has asked at one point. So as you (begrudgingly) prepare to create your first or next report, let's consider some of the most important benefits you and your team can reap from regularly reporting:- Progress tracking - If you don't know how to write reports, you won't know whether your marketing efforts are bringing you closer to your goals or not. Reports tell you which strategies are working well and which ones are underperforming so you can make adjustments or pivot quickly.
- Proof of success - Not everyone believes that marketing is a worthwhile investment. The reports you create can serve as a weapon to fight against this myopic school of thought and prove that the work you're doing is adding value to the business.
- Better alignment across teams - Reporting helps educate and inform relevant stakeholders about what's happening on the marketing front and what they can expect in the future. It ensures everyone is on the same page about how the company is performing, where it is headed, and what they can do to help it get there.
- Greater transparency - When your boss or client can see exactly what the marketing budget is being spent on and tie that to the results being generated, they'll feel more relaxed knowing their investment is yielding positive returns.
- Data-driven decision making - Reporting helps you determine how well your campaigns and strategies performed and how they impacted business goals like lead generation, customer retention, and revenue growth. This data will enable you to spot trends, build upon successful ideas, and make informed marketing decisions, rather than relying on guesswork and intuition.
How To Write A Report In 6 Steps
The truth is that writing great reports requires practice. The more you write, the better you will get at communicating and presenting your message succinctly.
Whether you're creating your very first report or you're looking for tips to help you streamline the process and improve the quality of your reports, follow these guidelines that I always use when writing reports.
How To Write A Report In 6 Steps:
1. Consider The Objective Of The Report
The first thing I do is think about the reason I'm creating the report and what it's supposed to accomplish. If you don't start out with a clear idea of why you're writing a report, you might end up including irrelevant data and creating a report that raises more questions than it answers. So ask yourself: What is the point of this report? What information do I want to share? What do I want the reader to learn from it? Maybe the purpose is to justify your marketing spend, demonstrate how successful a campaign was, to explain that you need more hands on deck to manage growth efforts. Having an objective in mind will help you focus the scope of your report on the data that matters most.2. Figure Out What Your Audience Needs To See
The next thing I consider is who the report is meant for. If I'm creating a report strictly for the marketing team, I can afford to include jargon, be more informal, and share my unfiltered thoughts on trends or the successes and failures of our strategies. I can't do that with reports meant for the CEO, board members, or external investors. They would be less interested in seeing breakdowns of metrics and figures and more concerned with how those numbers translate to ROI and revenue for the business. As the person in charge of writing blog posts and other aspects of digital marketing, all the data you generate may be important. But is the executive team going to find the AB tests you ran while crafting a newsletter, or is the number of opens and click-throughs that it generated relevant? So before you dive into writing your report, ask yourself: Who is my audience, and what would they want to know? For example, the financial director will want to know how your marketing spend is contributing to sales and influencing the bottom line. On the other hand, the head of marketing will want to be presented with an overview of different marketing campaigns and the effect they had on conversions, lead generations, and other profitability metrics. Understanding who you're reporting to will help you plan how to write a report and tailor the tone, language, and content to better align with their expectations.3. Decide What Information You Will Include
This is the point where I construct the outline for my report and figure out the data points I'm going to include to ensure the report is relevant and actionable. Naturally, the scope of the report will depend on the subject matter—social media, paid ads, SEO, email, etc.—and the number of platforms you will be sourcing the data from. However, I've found that creating an outline helps me figure out how to structure the flow of information and identify where I need to go to find the data, results, and resources I need to flesh out the report. An outline doesn't have to delve too much into the details. It should just be a skeletal framework of the key sections and subsections you want to include in your report based on the report's purpose. For instance, your outline can look like this: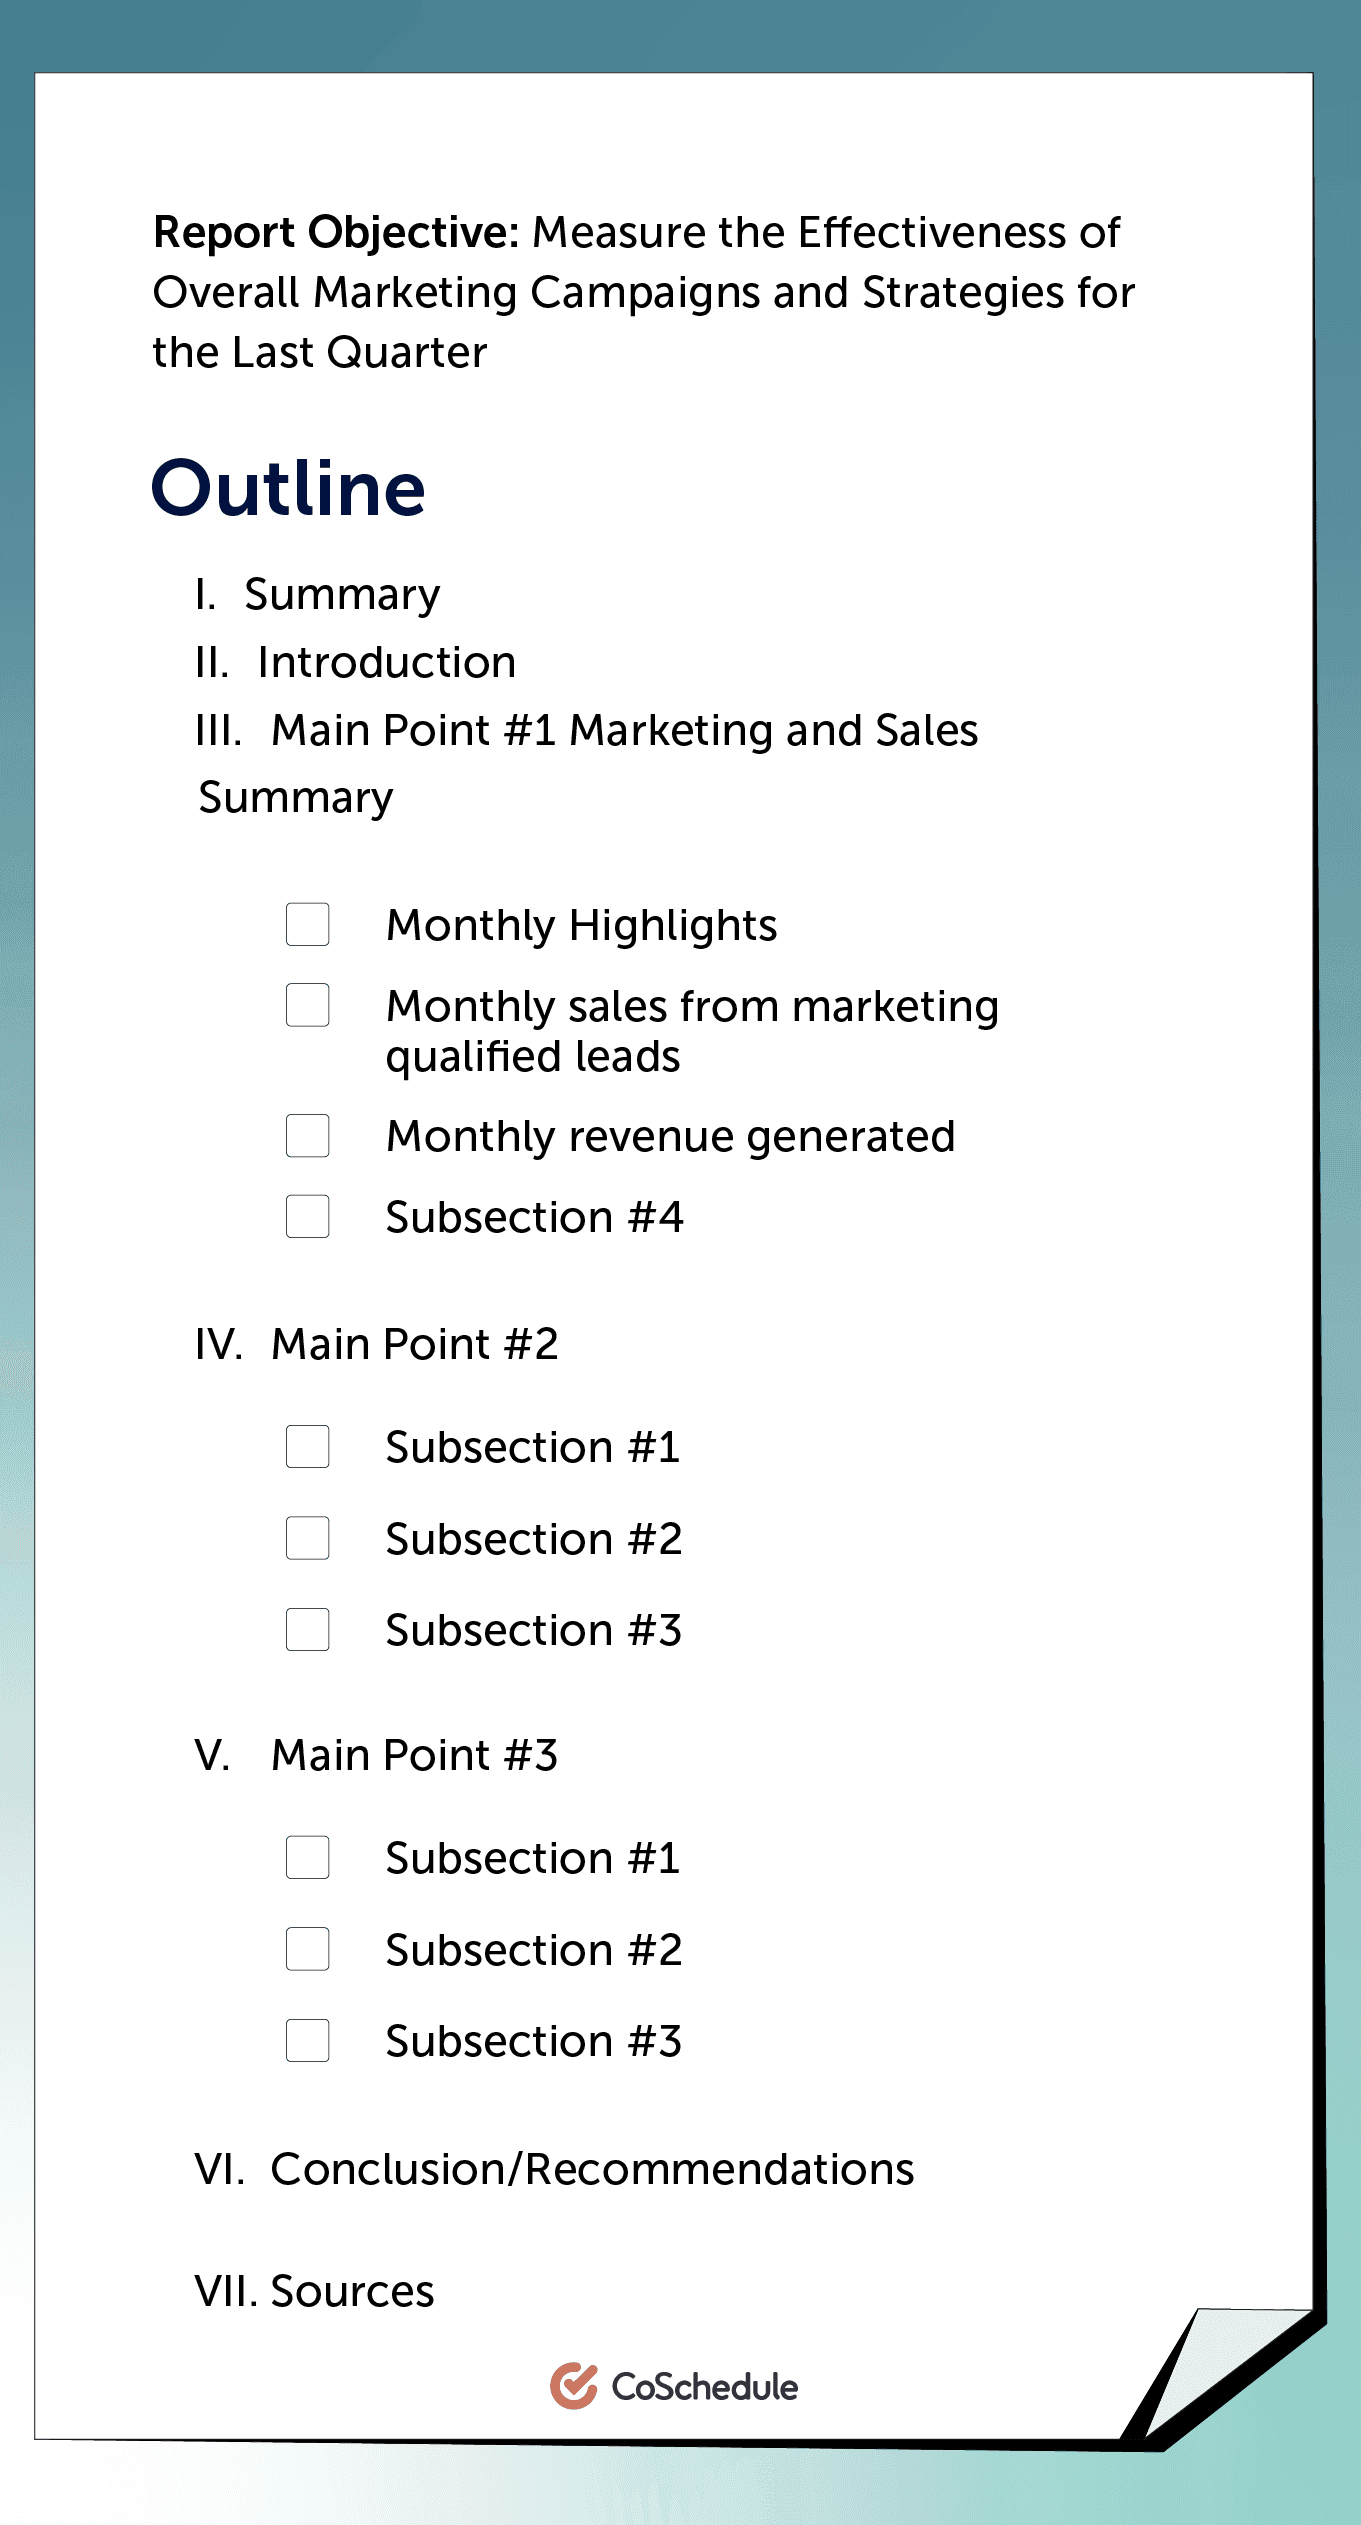
4. Collate Your Data & Visuals
Now that I know the purpose of my report, the audience I'm writing it for, and what it's going to cover, the next step is to begin gathering the data I will need for the report. I usually start by making a list of the relevant metrics that should be featured in my report based on the objective and outline I drew up earlier. The next thing to do is make a note of the platforms from which I will be sourcing each of those metrics and data. Then I add all of this information to my outline according to the headings and subheadings where they fall under. I recommend creating visuals to accompany your data so your report isn't just filled with boring numbers and text. You can use charts, images, graphs, icons, infographics, and more to visualize your content and drive home the point your data is making. Once all that is done, it's time to begin writing.5. Draft The Content Of Your Report
If, like me, you're the kind of person who wants your ideas to be perfect before you even put them down on the page, you have to learn to let go of perfection and just start writing. The first draft of your report is probably going to come out looking a little rough, but you'll have plenty of time to beat it into shape afterward. What matters most at this point is fleshing out all the main points and organizing your data on the page. How you compose your draft will vary depending on the report's objective and content, but following the structure below is usually a good starting point.1. Summarize Your Key Findings
The first page of your report should feature a summary of the report. Highlight the critical metrics, as well as the successes and failures of your marketing efforts for the period under consideration. Explain why things turned out the way they did, the problems you encountered in the course of executing campaigns, and the key takeaways from the performance recorded. Then discuss the strategies you will be employing in the future based on your findings. The summary is the first thing the reader will encounter in your report and it will determine if they will read the rest of the report or toss it out, so craft it as well as you can. However, I recommend waiting to write the summary, after you've written the other sections of the report. This way you can accurately summarize the content of the document.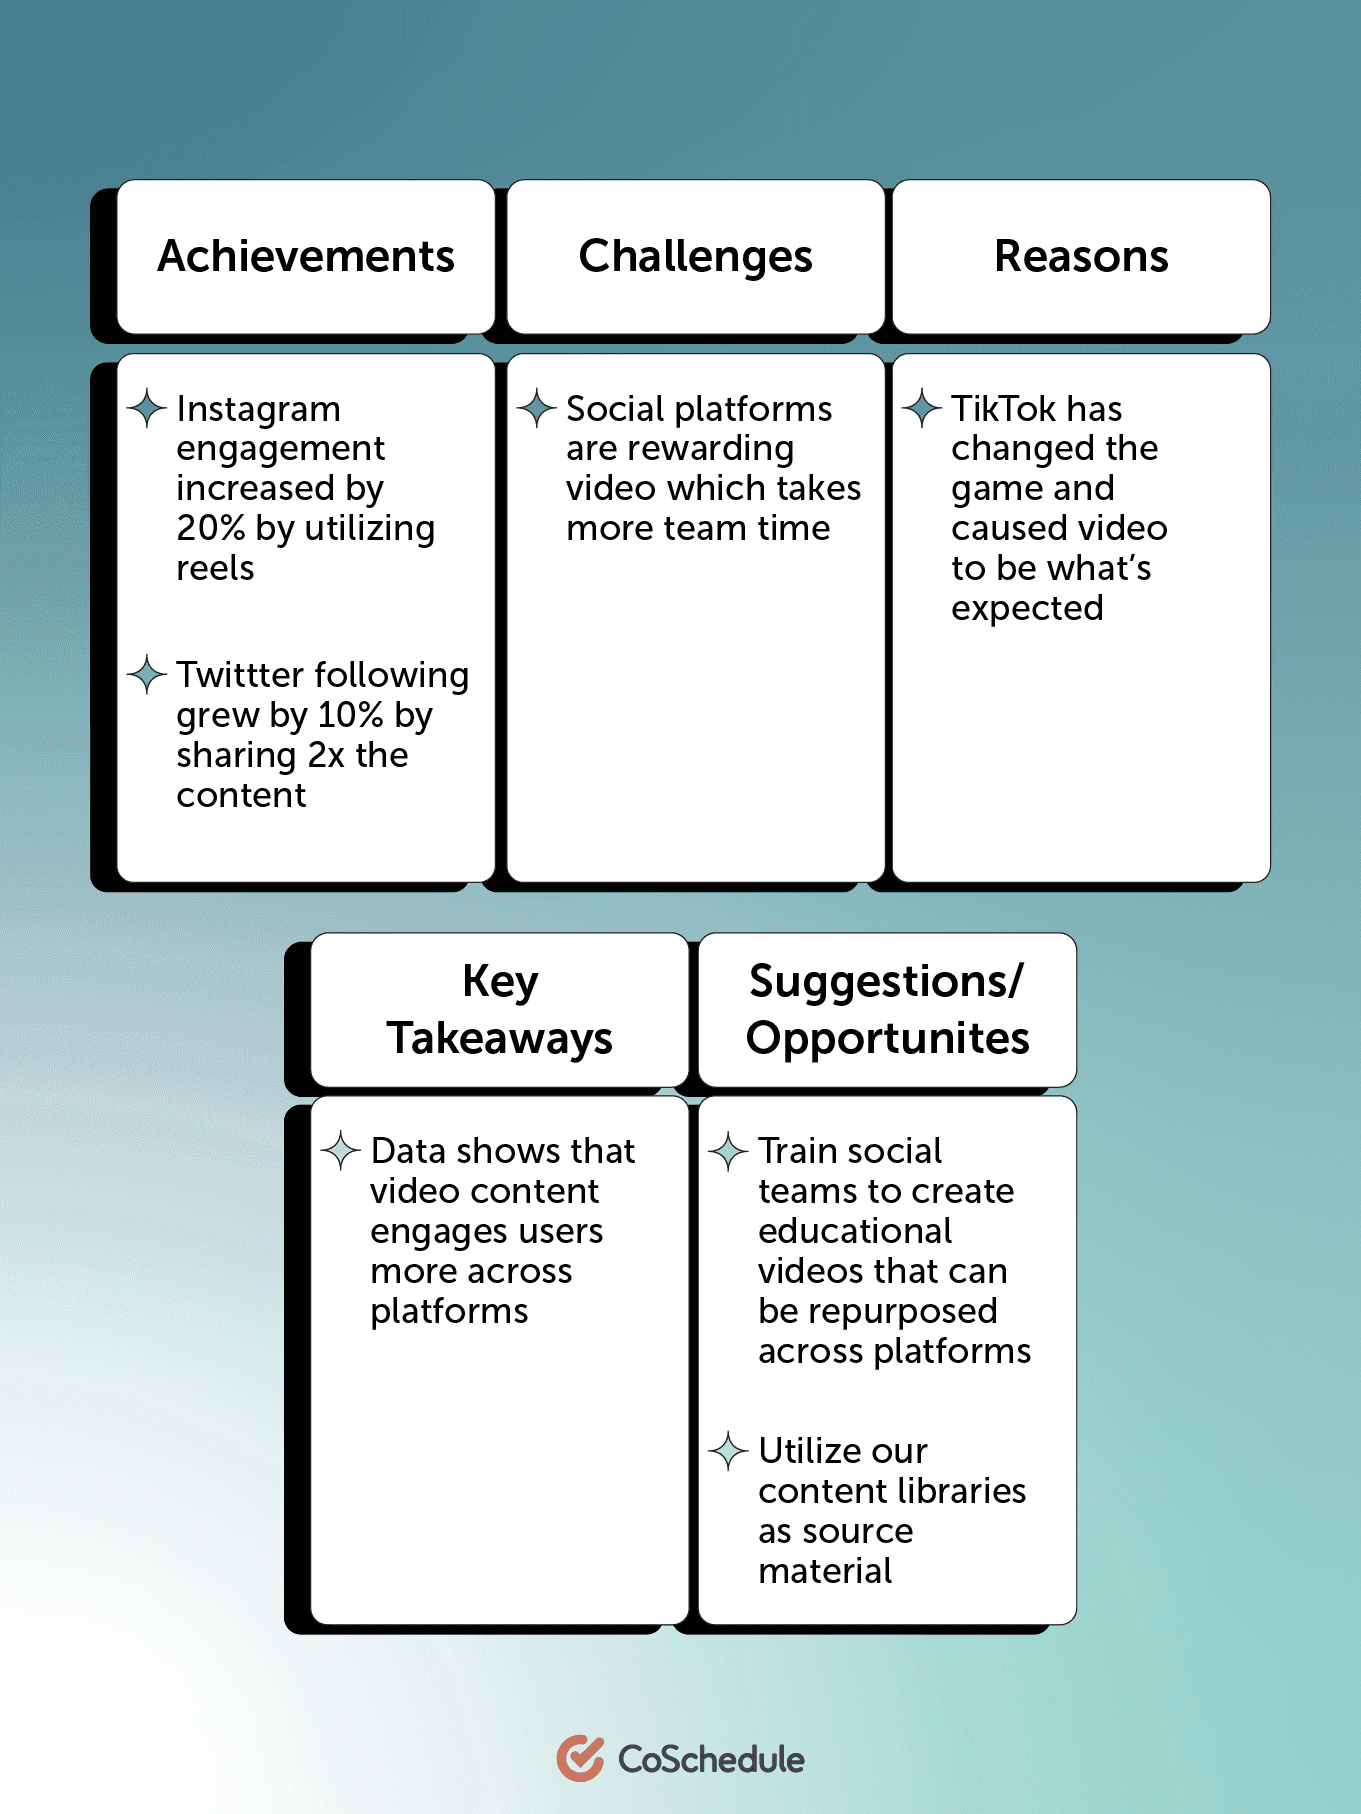
2. Craft An Introduction
This section is optional. I don't include it in most reports, especially those meant for departmental or internal company use because the intended reader likely already knows what the report is about. But if your report is meant to be read by external investors or a board of directors, you can use the introduction section to explain what your report is about, what it covers, and add any other additional context they might need.3. Dive Into The Body Of The Report
The body of your report is where you get to flex your writing muscles because it's the longest section. All that data you gathered earlier will be inserted along with detailed explanations, analysis, and benchmarks to add context to the numbers. It's not enough to say you generated 20% more leads from creating white papers in the last month and leave it that way. You have to talk about how it happened, which particular white paper drove most of the leads, and what was special about it. Explaining your metrics, successes, and even poor results will give the reader a better sense of what is happening. It will help build an accurate impression of the strategies underlying your marketing activities. Don't hide or misrepresent the negative data. Just be honest about what caused it and say how you plan to fix it. Take this report as an example of how you dive into the body of the report. Explain every metric, data, and even possible reasons leading to the results.4. Recommend An Action Plan
This is the concluding section of your report where you get to summarize your findings and discuss what they mean for your company. I like to go a step further by recommending the next steps that should be taken to improve performance and help the business gain a competitive advantage. So if after evaluating the data and outcomes you think your company would benefit from an increased budget for paid ads or from pursuing a specific tactic like influencer marketing or publishing press releases, don't hesitate to suggest it. As long as your report is compelling and you've demonstrated your knowledge and expertise, higher-ups are likely to accept and trust your recommendations. Tip: You can use marketing report templates to render your data and make more judicious use of your time.6. Review & Edit Your Report
Editing is the final phase of writing a report, and it's my favorite because it's an opportunity for me to make my document shine. After finishing my draft, I like to set it aside for a few hours or days, so I can return to it and begin editing with fresh eyes. Doing this allows me to catch mistakes I may not have noticed while writing. Read through what you've written down and remove any bits that seem unnecessary or irrelevant to keep your report concise and effective. Look out for typos and grammar mistakes and crosscheck your data to ensure accuracy. Break up long blocks of text and make sure the report has a cohesive narrative tying all the information together.Over To You
Your reports should showcase the progress you've made, address issues you're experiencing, and share actionable insights that can be used to make decisions affecting the business.
It's one of the most powerful communication tools you have in your arsenal and you can learn how to wield it using the guidelines I've laid out in this article.
Easily Create Reports With Marketing Suite
It doesn’t have to be difficult to create marketing reports. With the right tools, you can demonstrate the results of your marketing efforts easily & quickly.
With CoSchedule Marketing Suite, you can prove the value and productivity of your marketing team with a series of easy-to-export reports.
Marketing Suite features a variety of different reports to choose from including:
 Build custom reports to share what your marketing team completed for specific initiatives, teams, & more over the last month, quarter, or beyond.
You can even schedule reports to be sent out to an email address on a regular basis.
For example: Your boss may want a weekly update on the amount of projects that were completed.
To schedule an export, go to Analytics > Share > Schedule Report.
Build custom reports to share what your marketing team completed for specific initiatives, teams, & more over the last month, quarter, or beyond.
You can even schedule reports to be sent out to an email address on a regular basis.
For example: Your boss may want a weekly update on the amount of projects that were completed.
To schedule an export, go to Analytics > Share > Schedule Report.
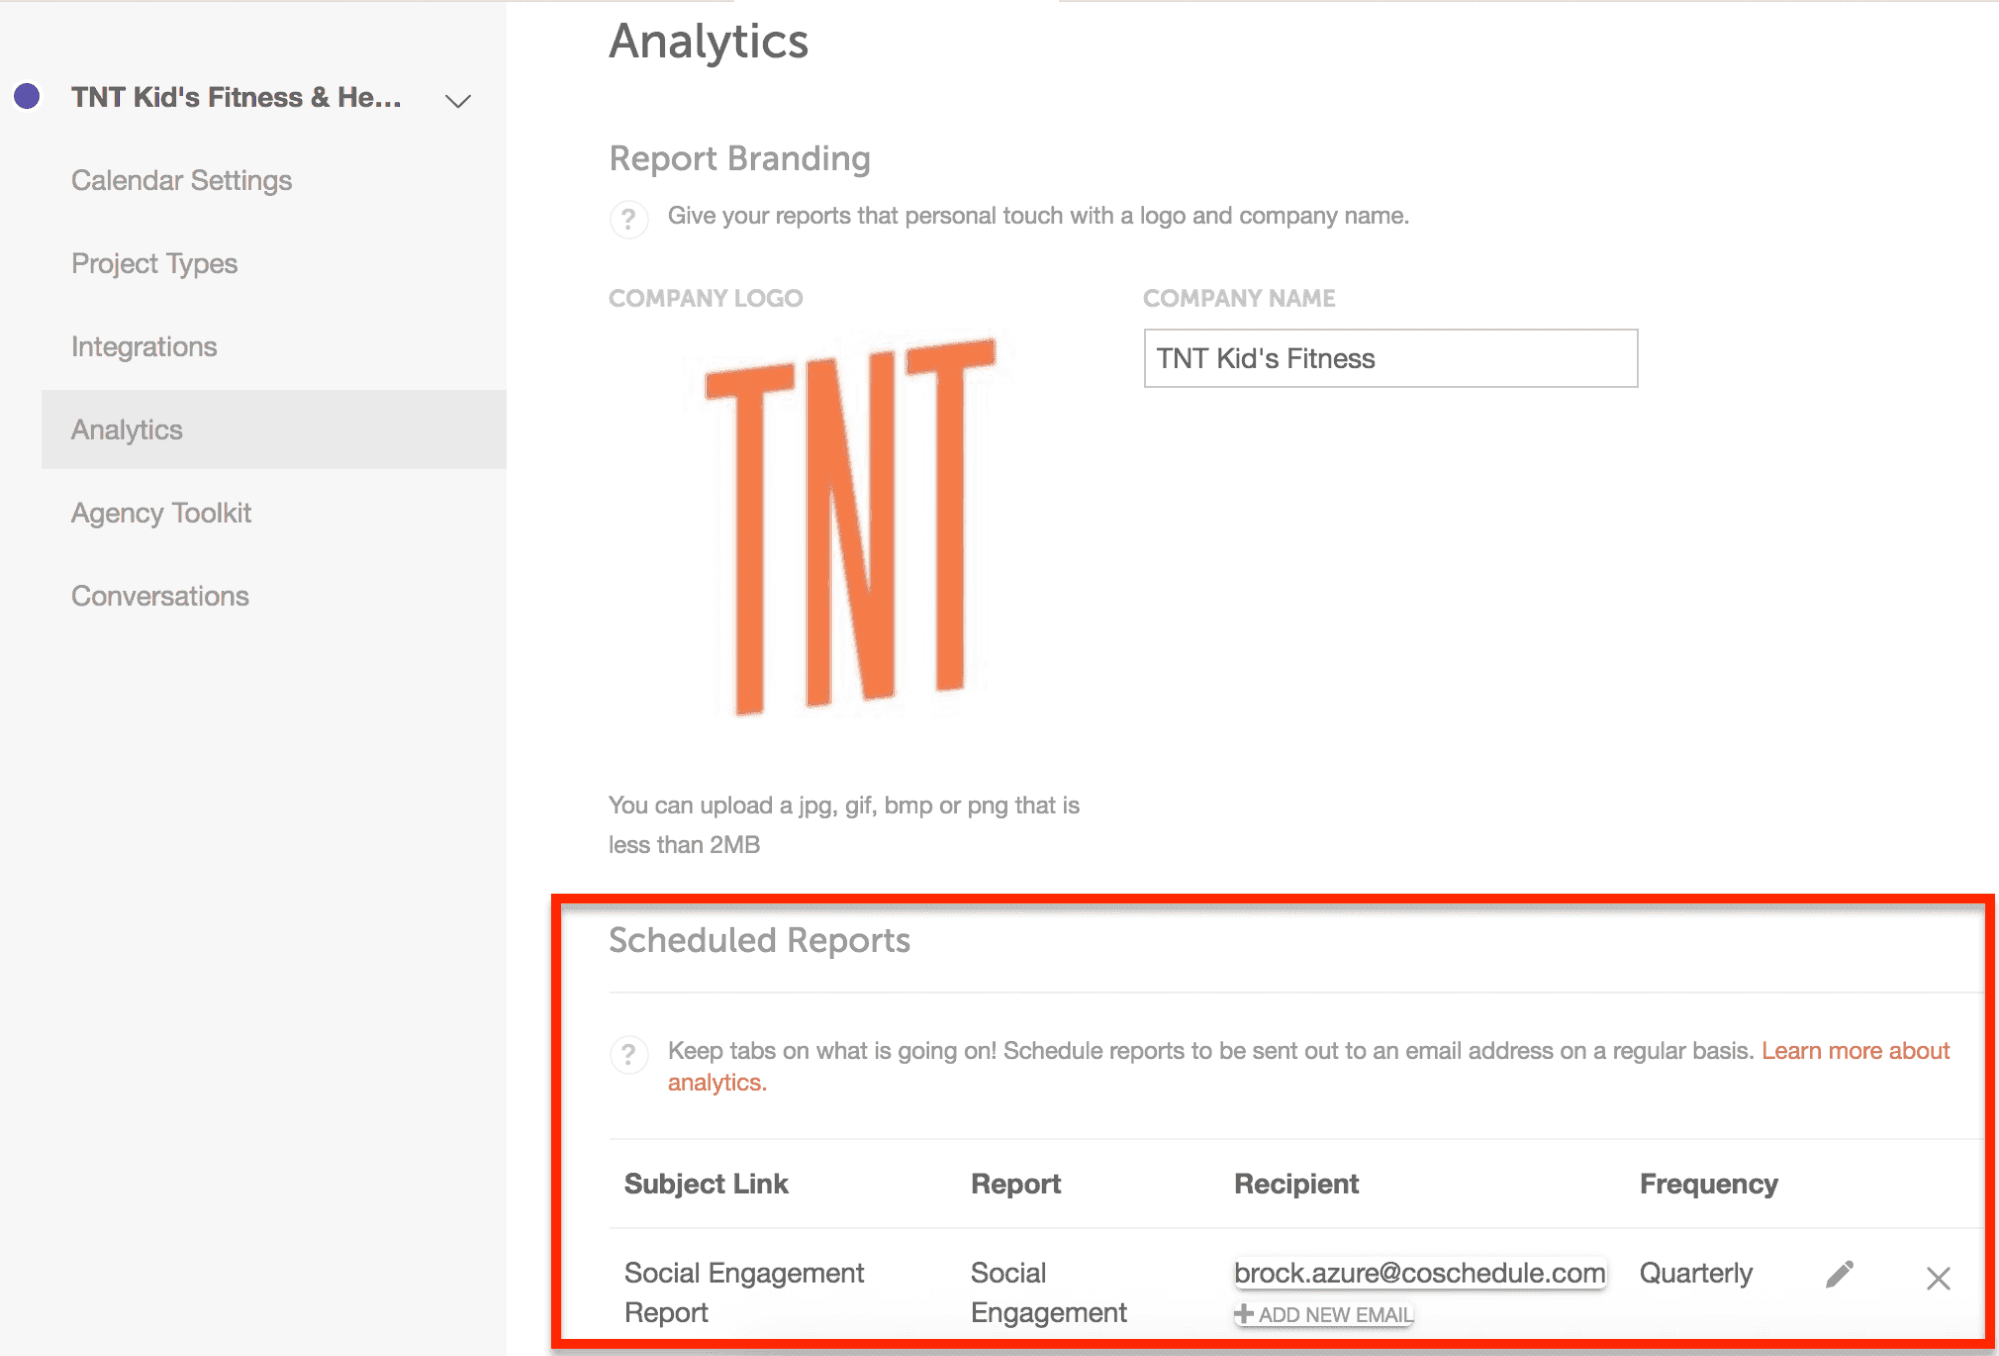
 To manage your scheduled exports, go to Settings > Analytics. Here you can see and edit who it’s sent to, when it’s sent, and which report it sends.
 Do you manage projects for different stakeholders that need a report every month?
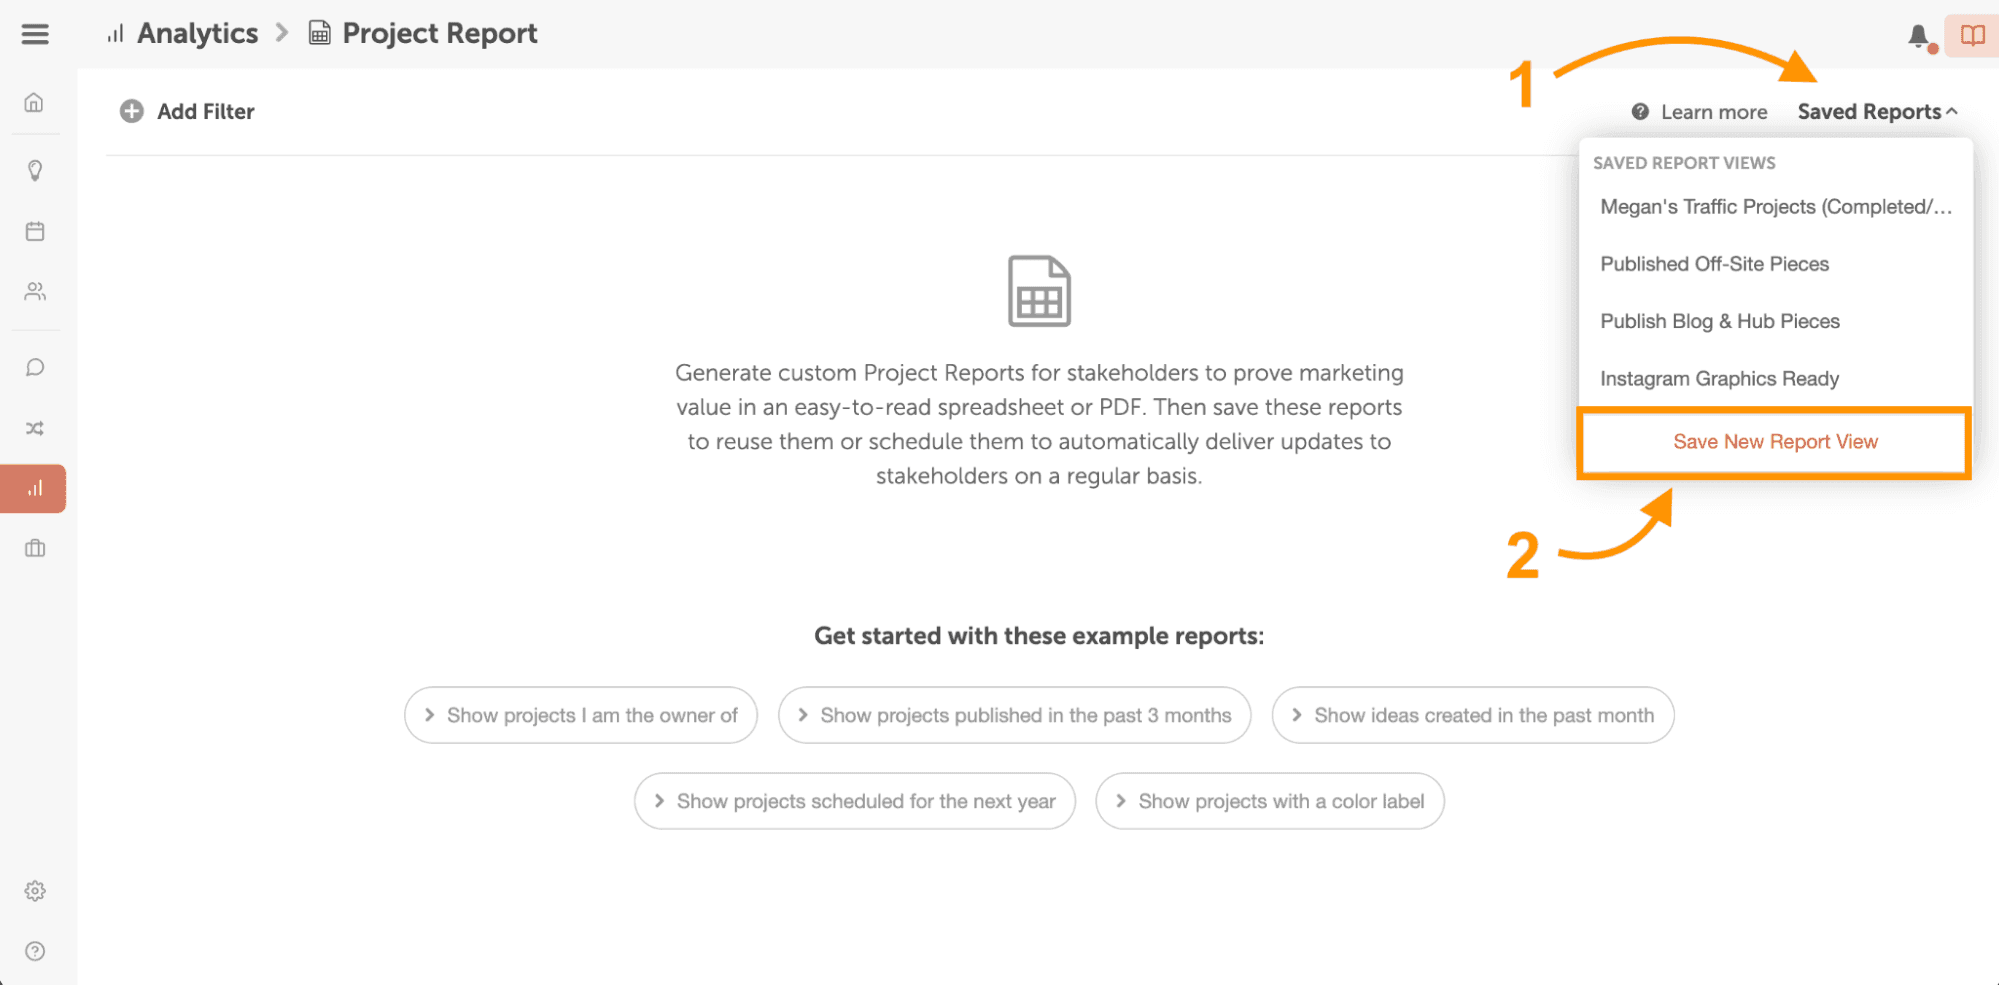
Easily customize and save these views by creating Saved Report Views. To add one, set your desired filters to show what needs to be seen and press Save New Report View.
Do you manage projects for different stakeholders that need a report every month?
Easily customize and save these views by creating Saved Report Views. To add one, set your desired filters to show what needs to be seen and press Save New Report View.
 Team Performance Reports
Gain powerful insight into your team’s productivity & progress in one report. Pinpoint areas of improvement, spot trends or project blockers limiting potential, and set realistic goals for your entire team without all the tedious data collection.
Team Performance Reports
Gain powerful insight into your team’s productivity & progress in one report. Pinpoint areas of improvement, spot trends or project blockers limiting potential, and set realistic goals for your entire team without all the tedious data collection.
 You can track and manage the progress and productivity of individual projects, campaigns, or team members.
 The Team Performance Report can help you:
 With Marketing Campaign Reports, you can:
 Social Campaign Report
s help highlight the success of your social campaigns. Evaluate performance in one place & pinpoint correlations between campaigns with side-by-side comparisons.
To view your Social Campaign Report, go to Analytics > Social Campaign Report.
To view the stats for a specific project or campaign, click Choose a marketing campaign or project.
To compare a social campaign with another, click Add a marketing campaign or content to compare.
Social Campaign Report
Social Campaign Reports help highlight the success of your social campaigns. Evaluate performance in one place & pinpoint correlations between campaigns with side-by-side comparisons.
To view your Social Campaign Report, go to Analytics > Social Campaign Report.
To view the stats for a specific project or campaign, click Choose a marketing campaign or project.
To compare a social campaign with another, click Add a marketing campaign or content to compare.
 Comparing two campaigns will give a quick snapshot of engagement and display which campaign performed the best.
 Social Profile Report
Discover the most effective social channels for your business by running reports for each specific profile. Pull stats to determine what times, days & messages work best for your profiles.
To do this, navigate to the Analytics Dashboard, choose which profile you want to view, and select a timeframe.
Social Profile Report
Discover the most effective social channels for your business by running reports for each specific profile. Pull stats to determine what times, days & messages work best for your profiles.
To do this, navigate to the Analytics Dashboard, choose which profile you want to view, and select a timeframe.
 This report gives you visibility of when messages were sent, when they performed best, and what types of messages are the most successful.
This data can help you improve your social strategy for each profile you manage.
Schedule your demo call to see how Marketing Suite can benefit your team: Schedule TODAY!
OR
Sign up for a free trial with Marketing Calendar: Create Your Forever-Free Marketing Calendar!
This report gives you visibility of when messages were sent, when they performed best, and what types of messages are the most successful.
This data can help you improve your social strategy for each profile you manage.
Schedule your demo call to see how Marketing Suite can benefit your team: Schedule TODAY!
OR
Sign up for a free trial with Marketing Calendar: Create Your Forever-Free Marketing Calendar!
- Project Report
- Team Performance Report
- Marketing Campaign Report
- Social Engagement Report
- Social Campaign Report
- Social Profile Reports for Facebook, Twitter, LinkedIn, & Pinterest
Build custom reports to share what your marketing team completed for specific initiatives, teams, & more over the last month, quarter, or beyond.
You can even schedule reports to be sent out to an email address on a regular basis.
For example: Your boss may want a weekly update on the amount of projects that were completed.
To schedule an export, go to Analytics > Share > Schedule Report.
To manage your scheduled exports, go to Settings > Analytics. Here you can see and edit who it’s sent to, when it’s sent, and which report it sends.
Project Analytics
Project Reports in Marketing Suite allow you to demonstrate what work your marketing team completed over designated periods of time for specific goals, teams, & beyond, including:- Quarterly Project Report to showcase everything marketing completed in Q1.
- Blog Post Report to show the blog posts published over the last month.
- Sales Update to share which projects were completed to help drive sales & support the Revenue team during the last 6 months.
- And much more!
- Click the Share button and select Export CSV.
- Open the downloaded document.
Do you manage projects for different stakeholders that need a report every month?
Easily customize and save these views by creating Saved Report Views. To add one, set your desired filters to show what needs to be seen and press Save New Report View.
Team Performance Reports
Gain powerful insight into your team’s productivity & progress in one report. Pinpoint areas of improvement, spot trends or project blockers limiting potential, and set realistic goals for your entire team without all the tedious data collection.
You can track and manage the progress and productivity of individual projects, campaigns, or team members.
The Team Performance Report can help you:
- Optimize workflows by easily identifying team members or specific roles that may need more (or less) time to complete their tasks
- Spot trends or project blockers that impact project timelines
- Set realistic goals for your entire team without all the tedious data collection
With Marketing Campaign Reports, you can:
- Demonstrate how marketing campaigns support business goals.
- Give stakeholders a high-level view of active & planned campaigns.
- Plan ahead & stay on top of upcoming campaigns throughout the year.
- Showcase a list of your team’s successful campaigns during annual reviews.
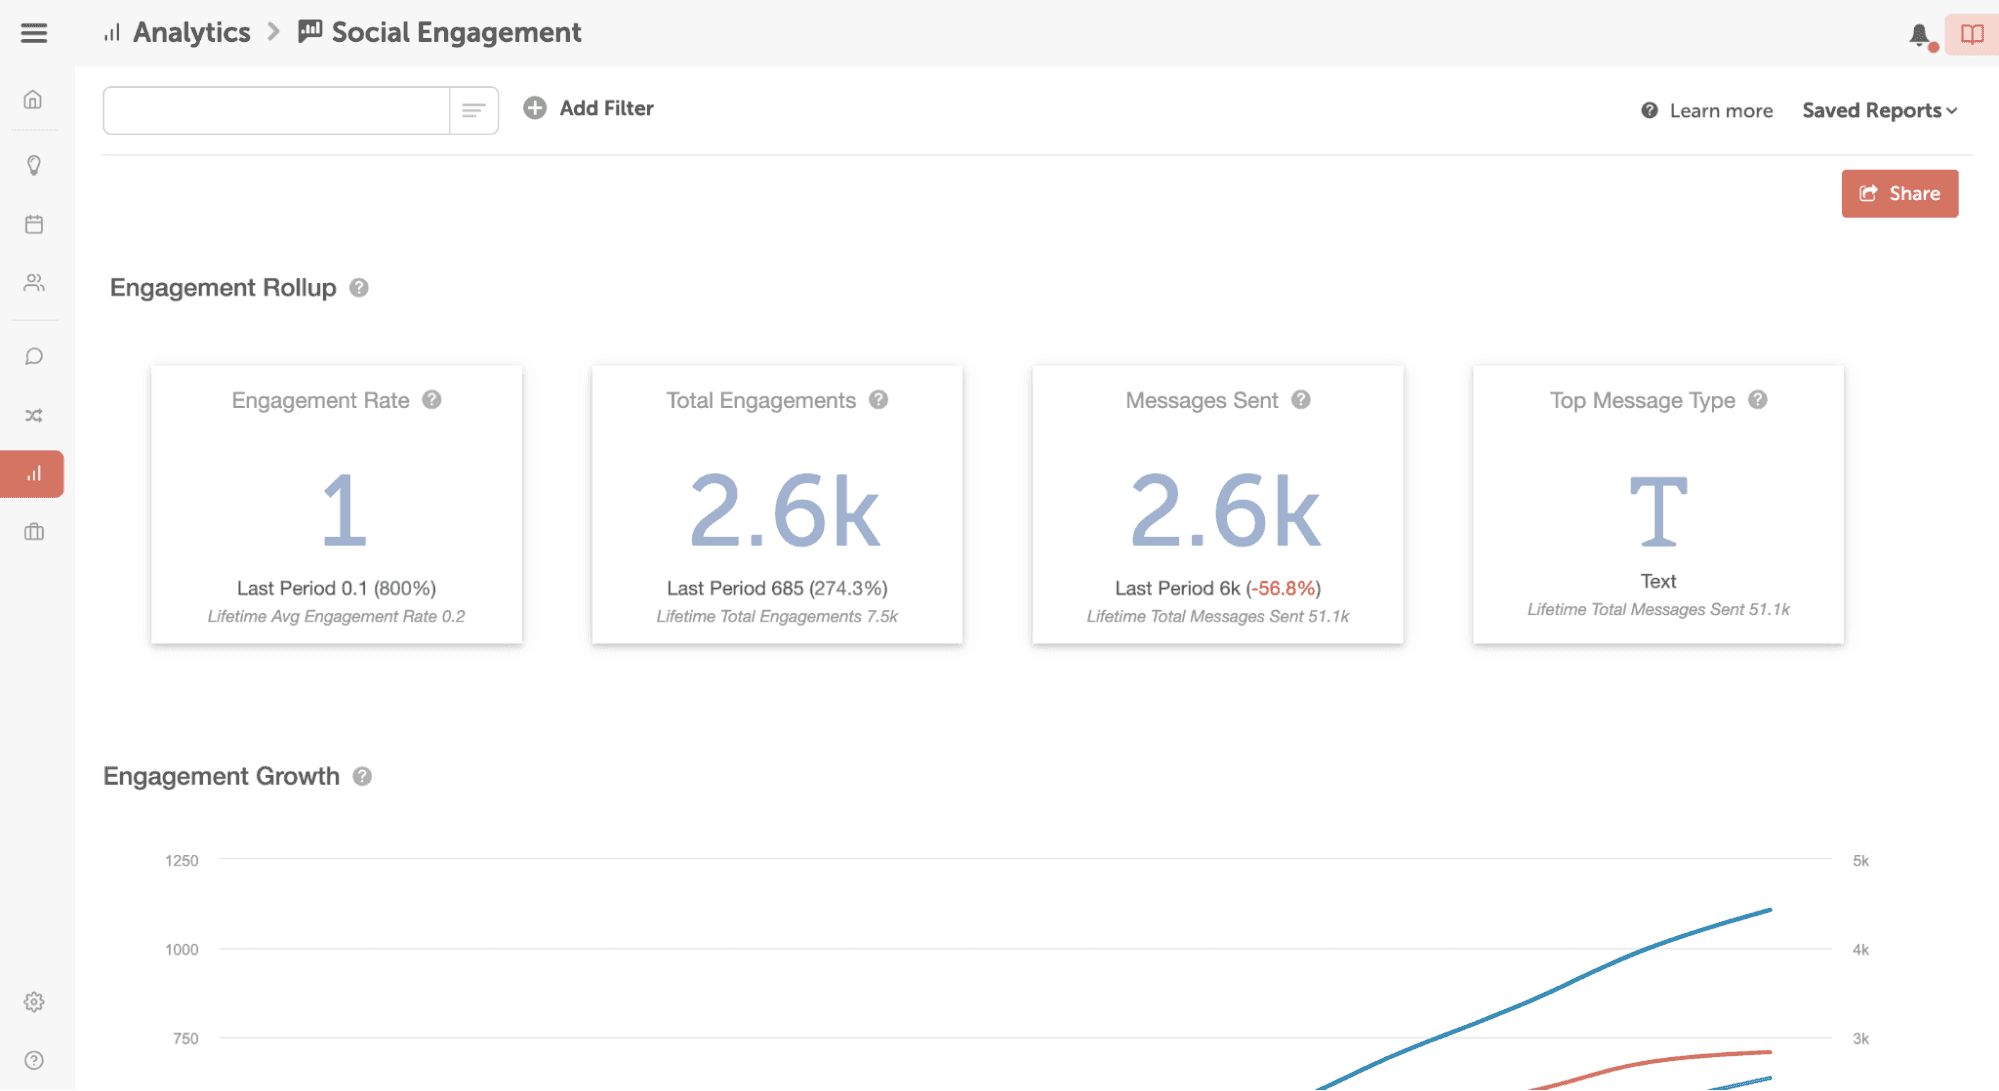
Social Analytics
Marketing Suite features a number of valuable social reports. Social Analytics help you translate data into real information you can actually use to improve your social strategy AND prove the ROI of your marketing. Social Engagement Report Social Engagement Report helps you understand your engagement on social media across all of your social profiles. Spot trends and understand what your audience likes to improve your strategy.
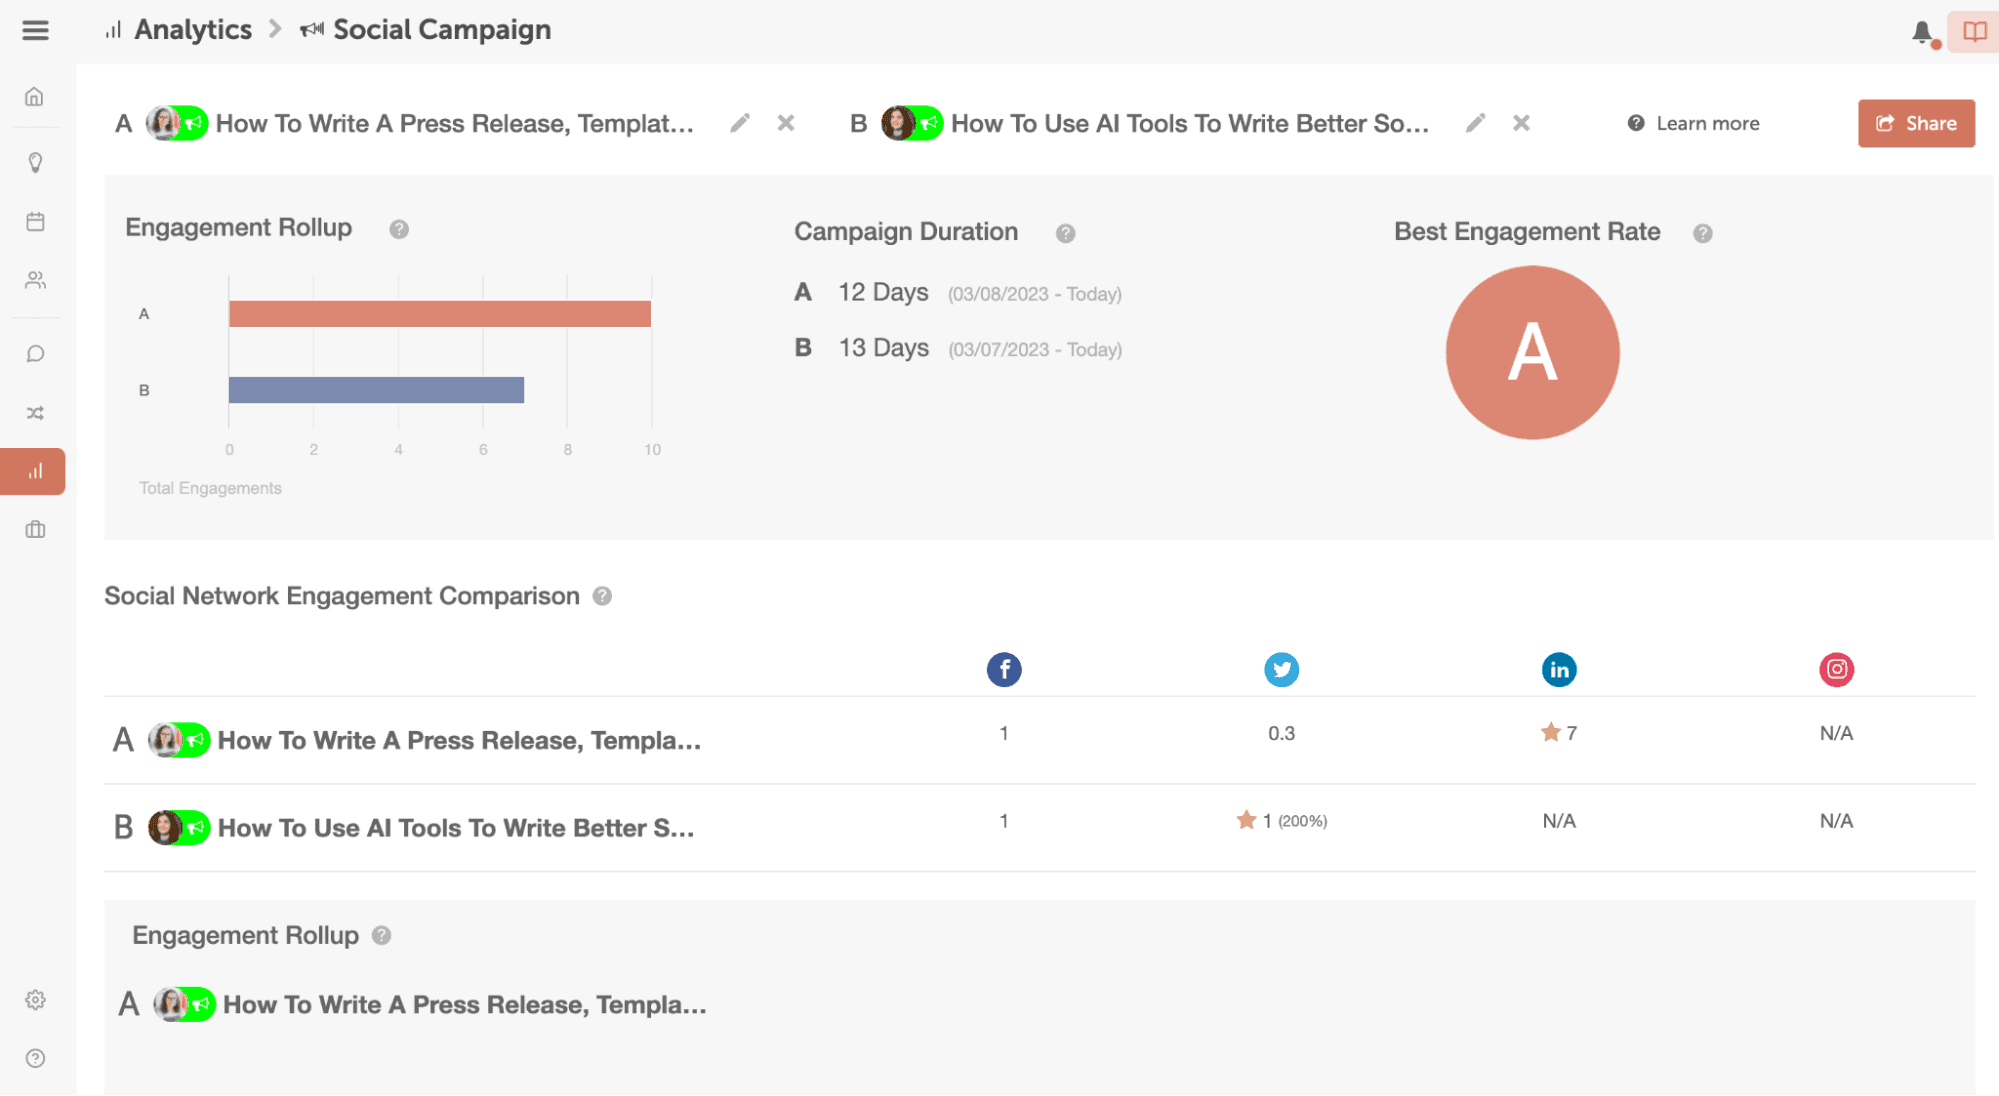
Social Campaign Report
Social Campaign Reports help highlight the success of your social campaigns. Evaluate performance in one place & pinpoint correlations between campaigns with side-by-side comparisons.
To view your Social Campaign Report, go to Analytics > Social Campaign Report.
To view the stats for a specific project or campaign, click Choose a marketing campaign or project.
To compare a social campaign with another, click Add a marketing campaign or content to compare.
Comparing two campaigns will give a quick snapshot of engagement and display which campaign performed the best.
Social Profile Report
Discover the most effective social channels for your business by running reports for each specific profile. Pull stats to determine what times, days & messages work best for your profiles.
To do this, navigate to the Analytics Dashboard, choose which profile you want to view, and select a timeframe.
This report gives you visibility of when messages were sent, when they performed best, and what types of messages are the most successful.
This data can help you improve your social strategy for each profile you manage.
Schedule your demo call to see how Marketing Suite can benefit your team: Schedule TODAY!
OR
Sign up for a free trial with Marketing Calendar: Create Your Forever-Free Marketing Calendar!


