
The digital marketing landscape’s rapid evolution instilled a new fear: Is email marketing dead?
But squashing such a myth, 40 percent of B2B marketers say email marketing is critical to content marketing success. Additionally, 73 percent of millennials prefer email communications from a business.
Thus, email marketing is proving alive and well.
An email influences the goal of marketing. But to do so, it must first:
- Be delivered into a subscriber’s email inbox.
- Be opened by a subscriber.
- Be engaged with—clicked, replied to, or forwarded—by a subscriber.
Understanding email marketing metrics and KPIs is the foundation of creating and optimizing email marketing campaigns.
Let’s begin by looking at metrics that apply specifically to emails, then dive deeper into overall email marketing strategy health.
A successful marketing email should reach the inbox, get opened, and be engaged with.
Check out CoSchedule’s Email Marketing Software: Elevate Your Digital Campaigns and transform your email results!
Additional email marketing metrics will help you understand if you’ve achieved these objectives or failed to influence the desired action. Let’s look at all of them.
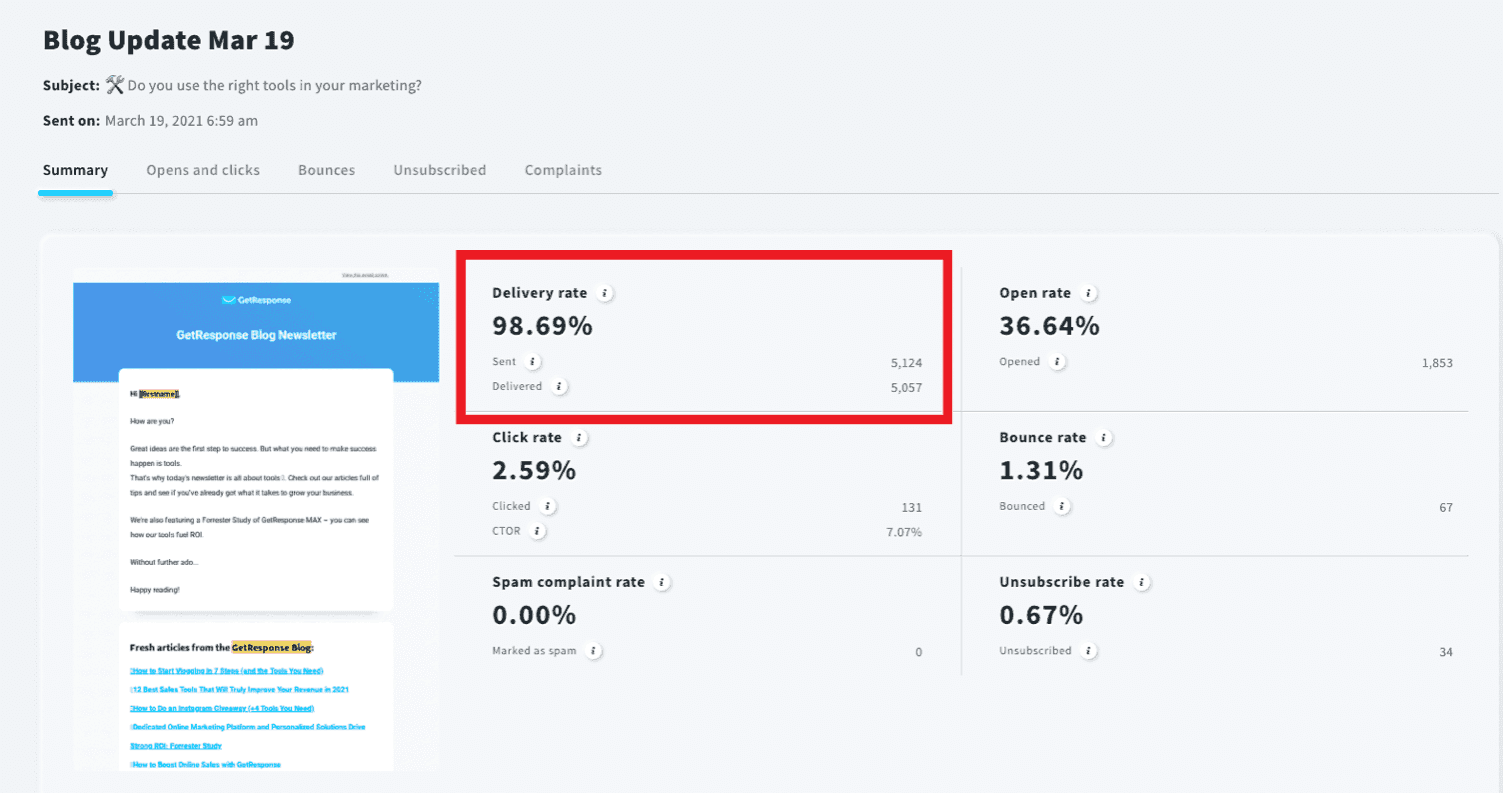
1. Deliveries & Delivered Rate
Delivery Rate measures how many emails were accepted by subscribers’ servers – a vital metric in understanding if your content is adequately received.
How to Calculate:
Delivery Rate Percentage
((# of Emails Sent – # of Bounces) ÷ # of Emails Sent)) x 100 = Delivery Rate Percentage
Example: ((500 Emails Sent – 20 Bounces) ÷ 500 Emails Sent) x 100 = 96% Delivery Rate
The best email campaigns can be successful by following deliverability best practices.
2. Opens & Open Rate
Opens and Open Rate refers to the number of email recipients who open an email.
Represented as a percentage, Open Rate can:
- Indicate how well a particular campaign is performing
- Identify the relationship strength between a brand and its email subscribers
- Evaluate the quality of content sent through an email
- Assess if an email has reached the ideal target audience
Open Rate Percentage
(# of Individuals Who Opened an Email ÷ # of Individuals Who Received the Email) x 100 = Open Rate Percentage
Example: (7,500 Emails Opened ÷ 10,000 Emails Sent) x 100 = 75% Open Rate
3. Clicks & Clickthrough Rate
Clicks and Clickthrough Rates measure the percentage of people who click on a hyperlink in an email.
This percentage reveals the success of an email marketing campaign and helps determine if the copy and subject line were effective in capturing users.
How to Calculate:
Clickthrough Rate Percentage
(# of People Who Clicked A Hyperlink ÷ # of People Who Saw The Link) x 100 = Clickthrough Rate Percentage
Example: (500 Individuals Clicked A Link ÷ 2,000 Individuals Saw The Link) x 100 = 25% Click Through Rate
4. Conversions & Conversion Rate
Conversion Rate is the percentage of email recipients who completed the desired action after receiving an email campaign.
This valuable metric is vital in moving customers through the marketing funnel and understanding the success of a singular email campaign.
How to Calculate:
Conversion Rate Percentage
(# of People Who Completed a Desired Action ÷ # of Total Delivered Emails) x 100 = Conversion Rate Percentage
Example: (500 Individuals Completed A Desired Action ÷ 10,000 Total Delivered Emails) x 100 = 5% conversion rate.
5. Revenue Per Email
Revenue Per Email is the monetary value of a subscriber on an email list.
Revenue helps determine how well an email campaign performs and how committed an existing list of subscribers is to a business.
How to Calculate:
Revenue Per Email
(Total Revenue Generated By Email Campaign ÷ Total Number of Emails Successfully Sent) = Revenue Per Email
Example: $3,000 generated in revenue ÷ 10,000 delivered emails = $0.3 revenue per email
6. Email Shares/Forwards & Sharing Rate
Email Sharing Rate is the percentage of email recipients who forward an email or hit the share button.
Sharing works wonders in generating new leads, and it is completely free.
How to Calculate:
Email Sharing Rate
(# of Forwards/Shares ÷ # of Emails Delivered) x 100 = Email Sharing Rate
Example: (30 shares ÷ 10,000 total delivered emails) x 100 = 0.3% email sharing rate
7. Unsubscribes & Unsubscribe Rate
Unsubscribes and Unsubscribe Rate refers to the users who opt out of a mailing list after an email marketing campaign. These individuals have chosen not to receive any further newsletters.
While it is certainly painful to see contacts moving on, maintaining a subscriber list of individuals who genuinely want to receive emails is vital. So, unsubscribes – within reason – is a good thing.
Check here for healthy unsubscribe rates across various industries.
How to Calculate:
Unsubscribe Rate
(# of Unsubscribes ÷ # of Emails Delivered) x 100 = Unsubscribe Rate
Example: (20 individuals unsubscribe ÷ 10,000 emails delivered) x 100 = 0.2% Unsubscribe Rate
Ways to reduce unsubscribe rate:
- Share what email recipients should expect
- Understand the goals of email marketing
- Follow the art of personalization
- Segment an email list by interest
- Ask for feedback
8. Bounces & Bounce Rate
Bounces and Bounce Rate refers to the percentage of email subscribers who did not receive a message because a mail server returned it. In other words, the email “bounced” back.
A full inbox, server issue, or invalid email address can cause bounces. If untreated, bounces can be detrimental to future email marketing campaigns. The best approach is to periodically verify email addresses from your lists to ensure they are still valid and can receive your emails.
How to Calculate:
Bounce Rate
(# of Email Bounces ÷ # of Emails Delivered) x 100 = Bounce Rate
Example: (20 Bounced Emails ÷ 10,000 Delivered Emails) x 100 = 0.2% Bounce Rate
9. Spam Complaints
Spam Complaints reports made by email recipients against unwanted emails.
Emails resulting in an excessive number of complaints could result in being blocked by ISPs.
How to Calculate:
Spam Rate
(# of Email Bounces ÷ # of Emails Delivered) x 100 = Spam Rate
Example: (10 Emails Marked As Spam ÷ 10,000 Delivered Emails) x 100 = 0.1% Spam Rate
To prevent Spam Complaints:
- Use personalization
- Send relevant content
- Only email permission-based contacts – never buy a subscriber list
- Do not overwhelm subscribers with too many emails
- Do not send too few emails – subscribers may forget they signed up
10. New Email Subscribers
Email Subscribers are internet users who allow periodic emails from a brand. But finding new users to email is challenging.
To tackle such difficulties, read email list-building tactics to grow your email subscribers.
To tackle such challenges, start here.
How to Calculate:
Number of Subscribers
Total Number of Opt-Ins – Total Number of Unsubscribes = Number of Subscribers
Example: 1,000 Opt-Ins – 300 Unsubscribes = 700 Subscribers
11. Email List Growth Rate
Email list growth rate is the progression at which an email contact list grows.
The average email list naturally suffers a 22 percent decay each year, so understanding subscriber growth rate – and maintaining a healthy size – is vital.
How to Calculate:
Email List Growth Rate
((# of New Subscribers – # of Unsubscribed) ÷ # of Emails Delivered) x 100 = Email List Growth Rate
Example: ((300 New Subscribers – 15 Unsubscribers) ÷ 10,000 Delivered Emails) x 100 = 2.85% Growth Rate
12. Active/Engaged Email Subscribers
Email marketing – if used correctly – creates a personal conversation between a brand and a subscriber.
To track that success, Active Email Subscribers refers to the number of subscribers consistently engaging with content.
How to Calculate:
% of Active Email Subscribers
(# of Subscribers that Engage ÷ # of Emails Delivered) x 100 = % of Active Email Subscribers
Example: (300 Subscribers that Engage ÷ 1,500 Emails Delivered) x 100 = 20% Active Email Subscribers
13. Engagement Over Time
Engagement Over Time compares subscriber participation across a given time.
With Engagement Over Time, marketers can:
- Assess consumer interactions
- Identify where subscribers are spending time
- Revise content dissemination strategies

14. Domain Open Rate
Domain Open Rate refers to the number of email opens for users on a given domain (Gmail, for instance).
Its measurement is useful when examining how email campaigns perform under different email providers. For example, is deliverability an issue in a particular domain?
How to Calculate:
Domain Open Rate
(# of Email Opens for a Given Domain ÷ # of Emails Delivered to a Particular Domain) = Domain Open Rate
Example: (300 Emails Opened in Gmail ÷ 500 Emails Delivered to Gmail) x 100 = 60% Domain Open Rate
15. Domain Click Rate
Domain Click Rate refers to the number of email clicks by users on a given domain (Gmail, for instance).
This measurement helps see how email campaigns perform under different email providers.
How to Calculate:
Domain Click Rate
(# of Email Clicks for a Given Domain ÷ # of Emails Delivered to a Particular Domain) = Domain Click Rate
Example: (300 Email Clicks in Gmail ÷ 500 Emails Delivered to Gmail) x 100 = 60% Domain Click Rate
16. Unsubscribe Rate
Unsubscribe Rate is the percentage of users who have opted out from an email list.
Such a metric helps understand what campaigns negatively impact an email list, highlighting future outreach ideas.
How to Calculate:
Unsubscribe Rate
(# of Email Recipients Who Unsubscribed ÷ # of Emails Delivered) x 100 = Unsubscribe Rate
Example: (10 Unsubscribes ÷ 500 Emails Delivered) x 100 = 2% Unsubscribe Rate
17. Bounce Rate
Bounce Rate refers to the percentage of undelivered emails.
It helps see the inaccuracies or outdated information of an email list. For example, you may discover invalid email addresses on your list.
How to Calculate:
Bounce Rate
(# of Undelivered Emails ÷ # of Emails Sent) x 100 = Bounce Rate
Example: 10 Undelivered Emails ÷ 800 Emails Sent x 100 = 1.25%
18. Conversion Rate
Conversion Rate is the percentage of email recipients who completed the desired action.
This valuable metric is critical in moving customers through the marketing funnel and understanding the overall success of email campaigns.
How to Calculate:
Conversion Rate Percentage
(# of People Who Completed a Desired Action ÷ # of Total Delivered Emails) x 100 = Conversion Rate Percentage
Example: (500 individuals completed the desired action ÷ 10,000 total delivered emails) x 100 = 5% conversion rate.
19. Revenue Per Subscriber
Revenue Per Subscriber is the amount of revenue generated by each subscriber.
It provides a direct insight into which strategies directly translate into dollars. Understanding Revenue Per Subscriber will drive ROI.
How to Calculate:
Revenue Per Subscriber
(Monthly Recurring Revenue ÷ # of Active Subscribers) = Revenue Per Subscriber
Example: $10,000 Monthly Recurring Revenue ÷ 500 Active Subscribers = $20 in Revenue Per Subscriber
20. ROI
Return on Investment (ROI) refers to the monetary value produced from an email marketing campaign versus its cost.
ROI is a popular profitability metric used to evaluate how well a campaign has performed financially.
How to Calculate:
ROI
((Gain from Investment – Cost of Investment) ÷ Cost of Investment) x 100 = ROI
Example: (($500 gained – $100 Cost) ÷ $100 Cost) x 100 = 400% ROI
21. Mobile Open Rate Vs. Desktop
Mobile Open Rate vs. Desktop refers to the ratio of email recipients who open an email on a Mobile Device vs. Desktop.
81 percent of all individuals prefer to use a mobile device to open emails. In comparison, 21 percent of individuals still prefer desktops.
Marketers must prioritize responsive design to drive the best possible outcome for mobile email campaigns.
How to Calculate:
Mobile Open Rate
(Total Unique Mobile Opens ÷ Total Recipients) x 100 = Mobile Open Rate
Example: (500 Unique Mobile Opens ÷ 2,500 Total Recipients) x 100 = 20% Mobile Open Rate
22. Mobile Click Rate Vs. Desktop
Mobile Open Rate vs. Desktop refers to the ratio of email recipients who click on a hyperlink in an email on a Mobile Device vs. on a Desktop.
However, despite mobile open rates rising, desktop users are 40 percent more likely to click a link than mobile users.
How to Calculate:
Mobile Clickthrough Rate
(Total Unique Mobile Clickthroughs ÷ Total Recipients) x 100 = Mobile Clickthrough Rate
Example: (600 Mobile Clickthroughs ÷ 4,000 Total Recipients) x 100 = 15% Mobile Clickthrough Rate
