
Here’s the problem: You’ve set up your website and begun publishing readworthy content but soon realize that it isn’t gaining viewers as anticipated.
Solution: Integrate website metrics to improve traffic and the viewer’s experience. Identify where the problem lies by looking at data-driven metrics.
88% of online consumers are less likely to return to a website after a bad experience. Your website is the stepping stone for moving consumers down the marketing funnel.
Let’s dive into the website metrics, KPIs, and tools to increase the value of your website’s performance and engagement.
To explore the tools that can help you optimize your website’s performance and drive more traffic, check out our article on Analytics Marketing Tools for a comprehensive guide.
What Are Website Metrics?
Website metrics numerically evaluate your website activities. Use website metrics to measure the overall success of your website goals.
Marketers use website metrics to enhance the user experience with the ultimate objective of converting website visitors to customers.
Recommended Reading: Website Name Generator
What Are Website Engagement Metrics?
Website Engagement Metrics
A series of website metrics that measure the interactions viewers have with your website.
Evaluate website engagement metrics to align your internet marketing strategy with the user’s interest.
What Are Website Performance Metrics?
Website Performance Metrics
Website metrics that analyze your webpage’s functions.
Your website is one of the first impressions viewers have of your business. Develop a user-friendly website to improve visitor retention and increase conversions.
Website Engagement Metrics
While there are many website engagement metrics, the following are the ones we have used the most at CoSchedule to make strategic website decisions:
- Users
- Sessions
- New Users
- Average Engagement Time
- Bounce Rate
- Conversion Rate
- Page Views
- Events Count
- Traffic Source
- Exit Rate
These all fall within three key categories:
- User Metrics (Audience & Acquisition)
- Engagement Metrics
- Conversion & Retention Metrics
User Metrics (Audience & Acquisition)
1. Users
Total Visitors
Total visitors are shown through the total number of users—both new and returning. Users initiate at least one session during the selected time range.
Calculate the number of website visitors to measure the popularity of your webpage and the effectiveness of your marketing strategy.
In Google Analytics, find Users under Reports > Acquisition > User Acquisition.

2. Sessions
A session represents a single visit to your website, including all interactions within a given time frame.
Tracking sessions helps measure how often users engage with your site.
In Google Analytics, find Sessions under Reports > Acquisition > Traffic Acquisition.

3. New Users
This metric shows the number of first-time visitors to your website within the selected period.
Monitoring new users helps determine how well your site attracts fresh audiences.
In Google Analytics, find New Users under Reports > Acquisition > User Acquisition.

4. Traffic Source
Unsure about Visitor Acquisition?
Traffic Source shows where your website traffic originates, such as organic search, direct visits, referrals, or paid ads.
Understanding traffic sources helps optimize marketing efforts and measure what is driving the most/highest quality traffic to your site.
In Google Analytics, find Traffic Source under Reports > Acquisition > Traffic Acquisition.

2. Engagement Metrics
1. Average Engagement Time
User Interaction Duration
Measures the average time users actively engage with your site. A higher engagement time suggests valuable and compelling content.
In Google Analytics, find Average Engagement Time under Reports > Engagement > Overview.

2. Bounce Rate
Single-Page Sessions
Bounce rate represents the percentage of sessions where users leave after viewing only one page. A high bounce rate can indicate issues with page content, design, or relevance.
To Calculate Bounce Rate in GA4:
Bounce Rate in GA4 can be approximated by using the Engagement Rate:

A session is considered “engaged” if:
- The user actively interacts with the page (e.g., scrolls, clicks, etc.) for more than 10 seconds or views more than one page.
Here’s how you can access the Engagement Rate:
- Go to:
Reports > Engagement > Overview - Look for:
- Engaged Sessions
- Engagement Rate
3. Page Views
Total Pages Viewed
The total number of times any page on your website is viewed.
High page views may indicate strong user interest but should be analyzed alongside engagement metrics.
In Google Analytics, find Page Views under Reports > Engagement > Pages and Screens.

4. Events Count
User Actions Tracked
This metric counts specific user interactions, such as button clicks, downloads, or video plays.
Tracking events helps analyze how users interact with your site.
In Google Analytics, find Events Count under Reports > Engagement > Events.

3. Conversion & Retention Metrics
1. Conversion Rate
Goal Completion Percentage
The percentage of users who complete a desired action, such as making a purchase or signing up for a newsletter.
A high conversion rate indicates an effective website experience.
In Google Analytics, go to:
Reports > Engagement > Events
(Here, you’ll see the events you’ve marked as conversions.)
If you have eCommerce tracking set up, go to:
Reports > Monetization > Ecommerce Purchases
(This shows purchase-related conversions.)
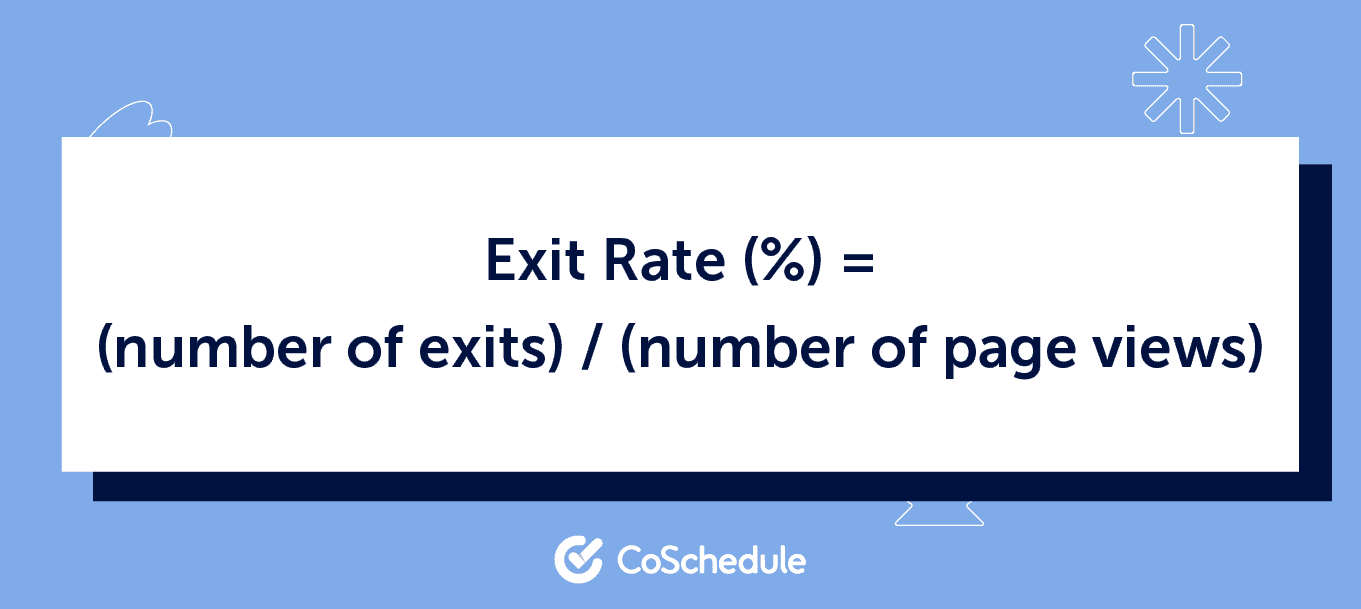
2. Exit Rate
Last Page Before Leaving
Represents the percentage of sessions where a specific page was the last page visited before leaving the site.
High exit rates may indicate issues with page content or navigation.
In Google Analytics, go to:
Reports > Engagement > Pages and Screens
Look for:
Exits: This shows the number of times a user exited from a particular page.
Pageviews: The total number of views for that page.
To calculate Exit Rate:
Exit Rate = (Exits / Pageviews) * 100
This will give you the percentage of sessions where users left your site after viewing that page.
Website Performance Metrics
The website performance metrics we review as a best practice at CoSchedule include the following, which we recommend for most marketing teams:
- % Pages with Good Mobile Page Experience
- Core Web Vitals (Mobile Performance)
- Largest Contentful Paint (LCP) Mobile (Good/Needs Improvement/Poor)
- Largest Contentful Paint (LCP) Mobile Time
- First Input Delay (FID) Time
- Cumulative Layout Shift (CLS) Time
- First Contentful Paint (FCP) Time
- Interaction to Next Paint (INP) Time
- Time to First Byte (TTFB) Time
- Page Mobile Performance Value
You can review website performance metrics across your entire site and dig deep into specific URLs.
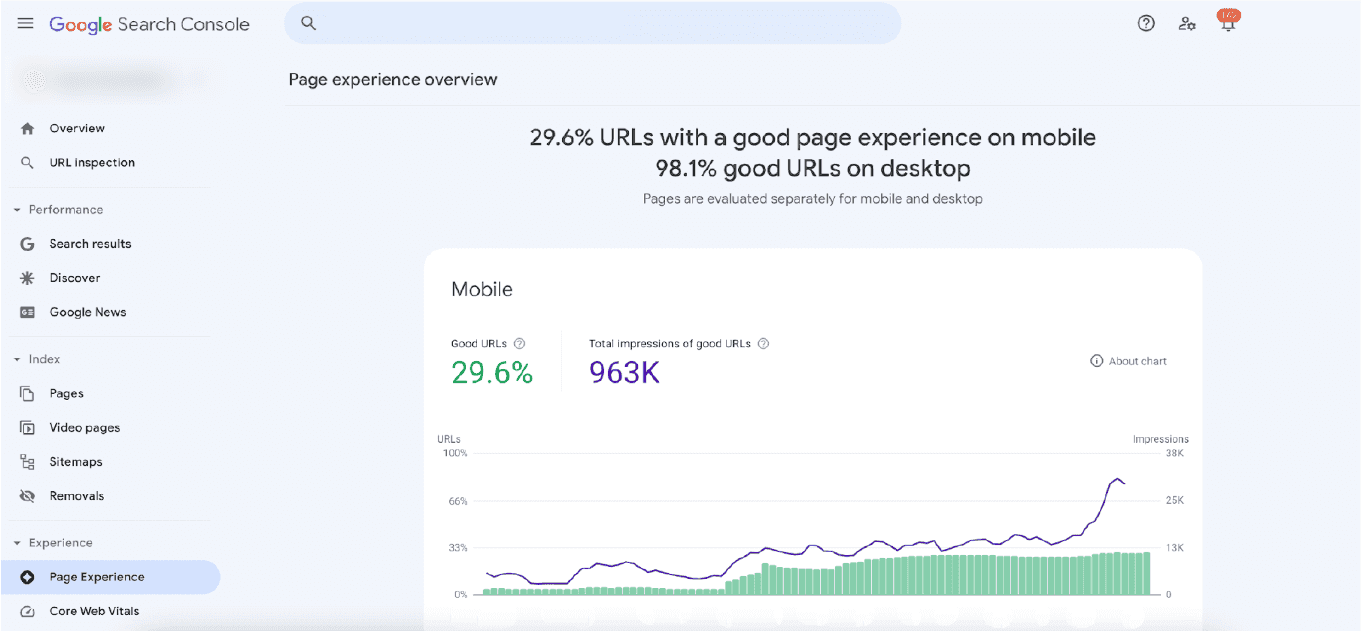
1. Percentage Of Pages With Good Mobile Page Experience
Analyze the percentage of mobile-friendly web pages to enhance the mobile experience for users. Ensuring a high percentage of pages meet the “Good” criteria for mobile experience helps improve user satisfaction and SEO rankings.
In Google Search Console, go to Page Experience to view the “Percentage of Pages with Good Mobile Page Experience.”
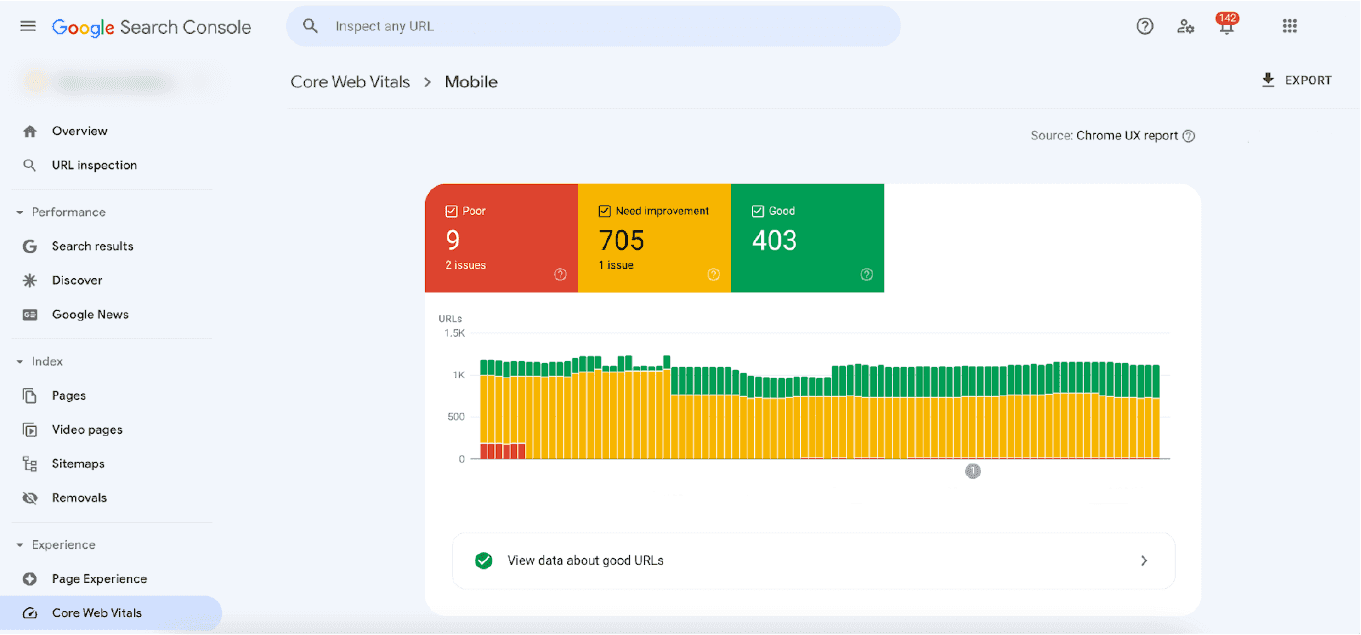
2. Core Web Vitals (Mobile Performance)
Core Web Vitals focus on key performance indicators for a website’s user experience. For mobile performance, it evaluates loading, interactivity, and visual stability. Tracking these metrics helps optimize a site for a better user experience on mobile devices, which is essential for SEO rankings.
Find “Core Web Vitals” on Google Search Console > Core Web Vitals.
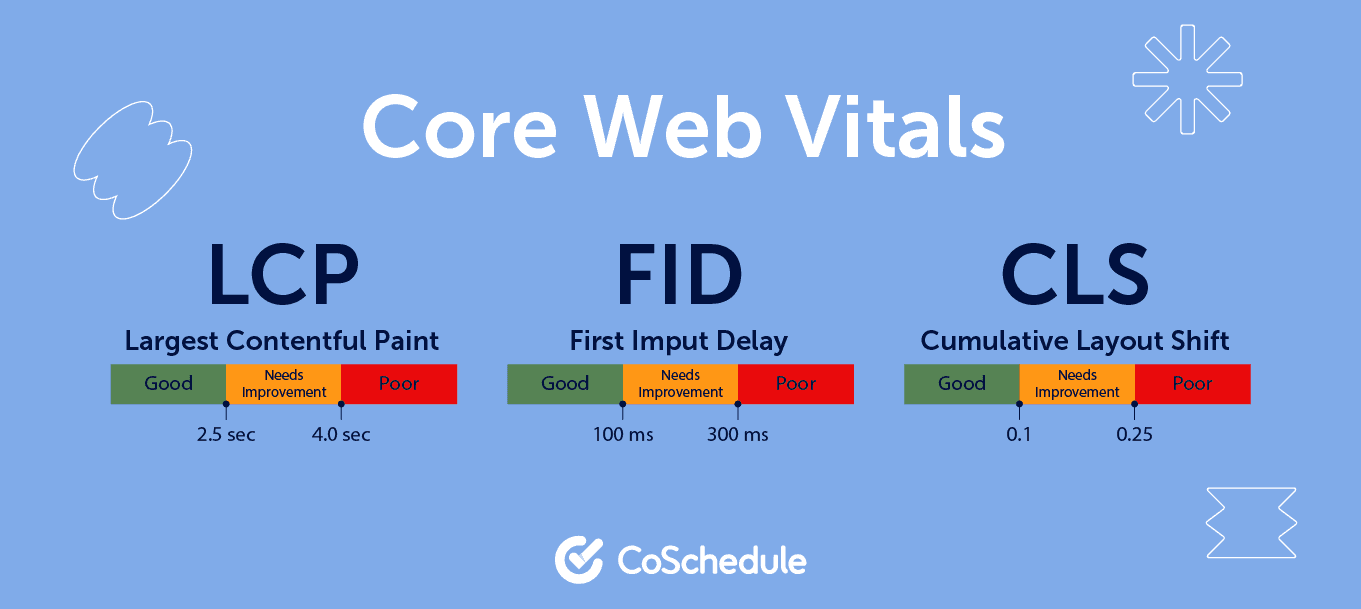
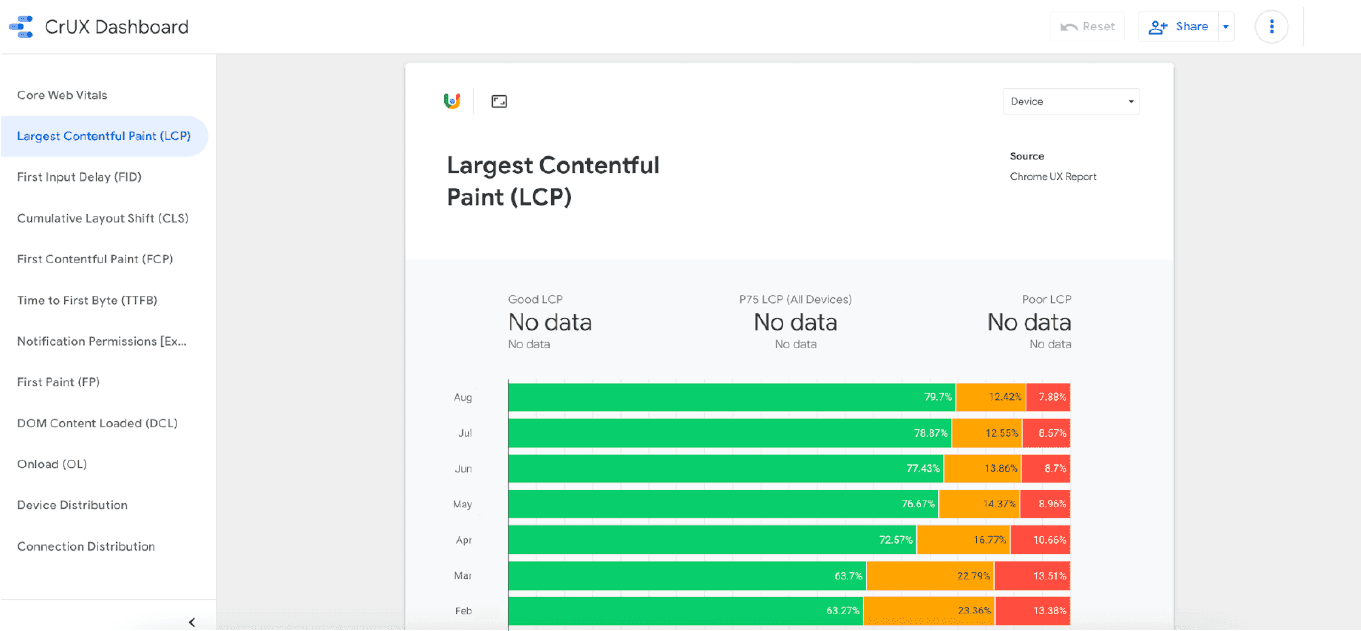
3. Largest Contentful Paint (LCP) Mobile (Good/Needs Improvement/Poor)
LCP measures how quickly the largest visible element (usually an image or text block) on a webpage loads. This metric is crucial for user experience since slow load times can lead to users abandoning the site. Pages should aim for an LCP of 2.5 seconds or less to achieve a “Good” score.
In Google Search Console, you can find the LCP performance under Core Web Vitals for mobile, categorized into three groups: Good, Needs Improvement, and Poor.
LCP Performance Thresholds:
Good: LCP ≤ 2.5s
Needs Improvement: LCP between 2.5s – 4s
Poor: LCP > 4s
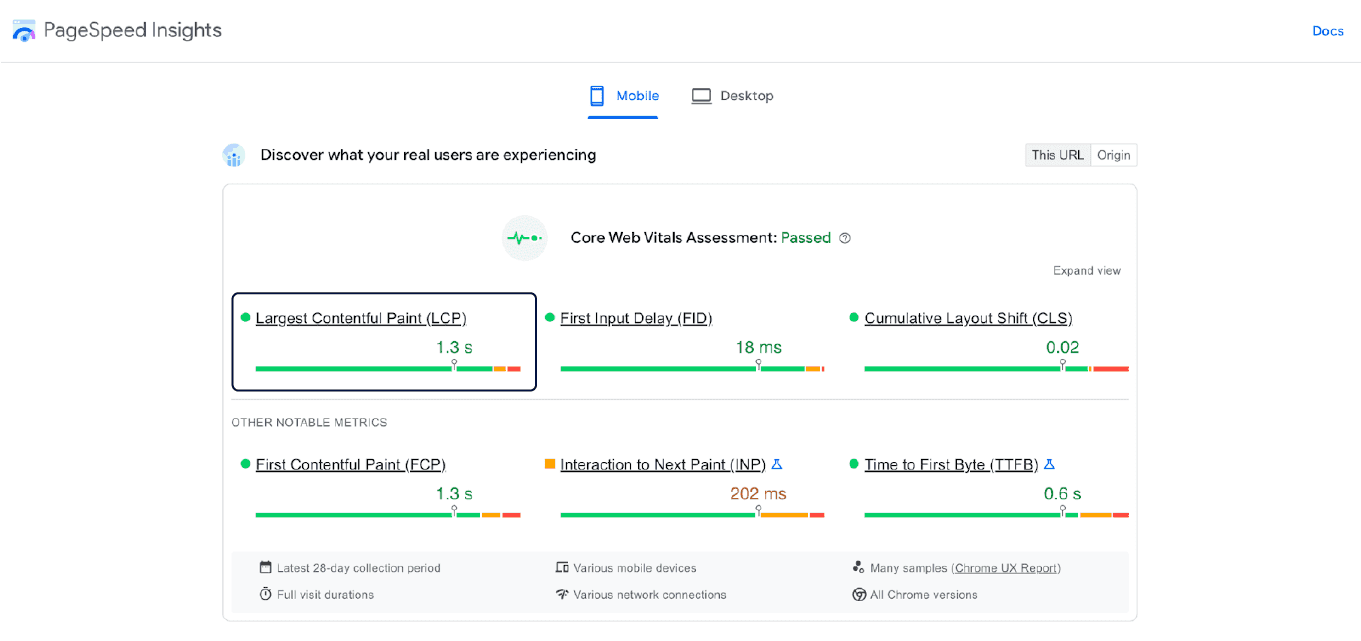
4. Largest Contentful Paint (LCP) Mobile Time
LCP time measures the exact duration it takes for the largest element on a page to load. The faster the LCP, the better the user experience. Pages that load in under 2.5 seconds are considered optimal for mobile. LCP time is a raw metric, reflecting the actual load time of the page’s largest element.
You can view the LCP time in Google Search Console under Core Web Vitals or track it in Google PageSpeed Insights.
However, unlike the Good/Needs Improvement/Poor classification, LCP time gives you the precise load time (e.g., 3.8 seconds) for the largest element, offering more granular insights for optimization.
5. First Input Delay (FID) Time
FID measures the delay between a user’s first interaction (like clicking a link or button) and when the browser responds to that action. A low FID (less than 100 milliseconds) ensures the page feels responsive and interactive.
In Google Search Console, find FID data under Core Web Vitals in the Page Experience report.

6. Cumulative Layout Shift (CLS) Time
CLS measures how much the page layout shifts unexpectedly during loading, which can cause poor user experience, especially on mobile. A CLS score of less than 0.1 indicates a stable and smooth page load.
Check CLS data in Google Search Console under Core Web Vitals in the Page Experience report.

7. First Contentful Paint (FCP) Time
FCP measures the time it takes for the first piece of content (text, image, etc.) to appear on the screen. A fast FCP ensures users see something loading right away, improving the perception of site speed. A target FCP of under 1.8 seconds is ideal.
Find FCP data in Google Search Console under Core Web Vitals in the Page Experience report.

8. Interaction to Next Paint (INP) Time
INP measures how responsive a page is to user interactions like clicks or scrolls. High INP values can indicate poor interactivity, which might frustrate users. Optimizing this metric leads to a smoother user experience.
You can view INP data using custom setup in Google Analytics 4 (GA4) or Google Tag Manager.

9. Time to First Byte (TTFB) Time
TTFB measures how long it takes for the server to respond after a user requests a page. A high TTFB can indicate server issues or slow web hosting, negatively affecting load times. Optimally, TTFB should be under 200 milliseconds.
In Google Analytics, check TTFB data under Behavior > Site Speed reports.

10. Page Mobile Performance Value
This metric provides an overall view of how well a page performs on mobile devices, combining factors like load times, interactivity, and visual stability. It helps prioritize mobile optimizations.
To check this value, you can use Google Lighthouse for a mobile performance score or find mobile performance insights in Google Search Console under
The 5 Best Website KPIs Shortlist
Tracking the right metrics is essential for website growth, especially when focusing on organic search. Here’s a shortlist of the most impactful KPIs for businesses looking to grow through organic search tactics:
1. Total Visitors by Channel
Track visitors from key channels:
- Organic Search
- Direct
- Referral
- Social
- Paid Search
- Display
2. Total Visitors by Tactic
Measure user engagement by site areas:
- Product Pages
- Blog
- Content Hubs
3. Website Speed & Usability
Focus on improving page speed and usability to support SEO efforts:
- % Pages with Good Mobile Experience
- Core Web Vitals
- Largest Contentful Paint (LCP) Mobile
4. Total Keyword Rankings
Track keyword performance as a lead indicator of organic traffic growth:
- Domain Rating
- of Organic Keywords in Top Rankings
5. Conversions
Measure conversions to track profitable customer actions:
- Email Subscribers
- Software Signups
- Customer Conversions
These KPIs focus on organic growth and user experience, essential for long-term website success.
To get the most out of your website, regularly tracking and analyzing these metrics is key. By understanding how users interact with your site, you can make data-driven decisions to improve performance, boost engagement, and drive more conversions. Start optimizing today for a better user experience and stronger results.
