
Choosing the right digital marketing metrics to measure is vital in increasing your company’s brand awareness, discovery, conversions, and engagement.
Keep your digital marketing successful with a strategy that continues to drive ROI. By measuring digital marketing metrics and defining KPIs, you can accurately pinpoint the value of your digital marketing.
What Are Digital Marketing Metrics?
Digital marketing metrics are a quantitative measurement to evaluate the performance of digital activities – blogs, videos, social media platforms, webpages, ads, etc. Interpret the data to assess the overall health of your digital marketing strategy.
What Are Digital Marketing KPIs?
Digital marketing KPIs (key performance indicators) are a subset of digital marketing metrics. KPIs measure the progress toward specific digital marketing goals and objectives.
Nearly all digital marketing exists to attract, engage, and convert successful customers. The metrics marketers use to measure their success fall within five key areas:
5 Key Marketing Metrics
- Impressions – How many times a piece of content or advertisement is placed in front of someone
- Clickthroughs – Number of clicks on specific links
- Traffic – Number of visitors a site gets within a particular timeframe
- Engagements – How many people interact with a post
- Conversions – When a customer completes a desired action
Enhance your SEO workflow—read “Backlink Monitoring Tools: Working Mechanisms and Top Tools” now!
1. Impressions
Prospective customers must see the marketing to achieve success.
Impressions reflect the amount of times content was viewed on the reader’s screen. The goal of marketing is to influence profitable customer action. Without impressions, this can not be achieved.
Impressions often occur when scrolling through search engine results, social media feeds, email inboxes, websites that display ads, and similar channels.
2. Clickthroughs
Upon seeing digital marketing, prospective customers must click through to view the page on which marketers may engage and convert prospects. Without clicks, digital marketers have no traffic to convert. Try this formula to calculate your clickthrough rate percentage: % = (# of clicks / Total impressions) * 100
 Clickthroughs occur when prospects click a search engine result, click a social media post or ad, click an email subject line (open rate), click a link in the email, click on a display ad, and similar methods.
3. Traffic
Traffic typically measures the number of people who visit desired webpages.
Without traffic—whether to a social media page (e.g., events), a third-party e-commerce site (e.g., Amazon, Etsy, etc.), or an owned website landing page (e.g., product signup page)—no engagements or conversions are possible.
4. Engagements
Engagements occur when prospective customers interact with the page or content they are visiting/viewing. These interactions could include reading the content, watching videos, downloading an ebook, sharing the content on social media, clicking forward in a multi-page experience, and similar activities.
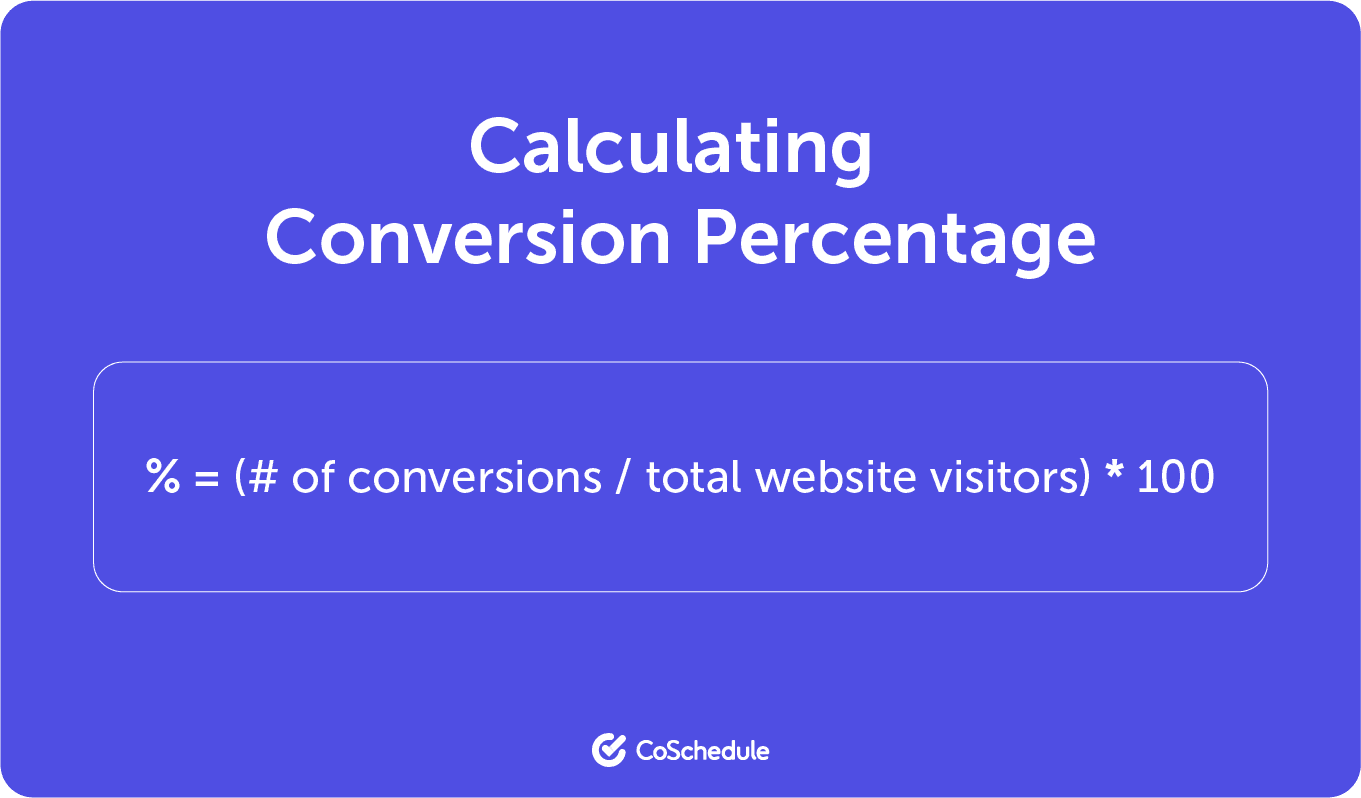
5. Conversions
Conversions are engagements that typically measure a lead indicator of profitability, such as signing up for a trial, scheduling a sales call, or even purchasing a product. Try this formula to calculate your conversion percentage: % = (# of conversions / total website visitors) * 100)
Once you’ve successfully converted visitors into customers, the next step is keeping them. Customer retention is critical to ensuring ongoing profitability and loyalty. It’s more cost-effective to retain existing customers than to acquire new ones. Metrics like repeat purchases, customer lifetime value (CLV), and churn rate help marketers track retention success.
With this in mind, let’s explore more digital marketing metrics and their potential KPIs.
8 Digital Marketing Metric KPI Categories
1. Brand Awareness
Brand awareness metrics describe how well your brand is reaching your target audience. Follow your company’s marketing campaigns to make your brand recognizable.
Track digital marketing brand awareness through these KPIs:
- Brand searches
- Social media followers
- Social media engagements (likes, comments, shares, clicks)
- Ad impressions
These metrics help you assess whether your target audience is actively seeking out your brand, interacting with your content, and how often your ads are being seen. By understanding these behaviors, you can refine your messaging and creative strategies to better connect with your audience.
By monitoring these KPIs, you can evaluate the effectiveness of your marketing campaigns and adjust your strategy to increase visibility and drive deeper audience engagement. Regular tracking ensures you’re staying aligned with your brand’s growth goals and can quickly pivot when necessary.
2. Search Engine Optimization (SEO)
Marketing teams use SEO digital marketing metrics to measure the performance of organic search results on the company website. Search Engine Optimization (SEO) is a critical component of any digital marketing strategy, focusing on improving a website’s visibility in organic search results. By tracking key SEO KPIs, marketing teams can gauge the effectiveness of their SEO efforts and identify areas for improvement. Metrics like Search Engine Results Page (SERP) impressions, Share of Search, and SEO rankings provide insight into how well your website is performing in search engines like Google and Bing.
Utilize these digital marketing SEO KPIs to increase search engine performance:
- Search engine results page (SERP) impressions
- Share of search
- SEO rankings
3. Traffic
Digital marketing traffic provides insight into the habits and behaviors of website visitors. Use the traffic metric to measure your website’s overall performance.
Traffic KPI’s to follow:
- Total users: Number of new and returning users
- New users: Number of users who visit your site for the first time
- Returning users: Number of users who have visited your site before
- Pageviews: Total number of pages viewed (includes repeated views of a single page)
- Unique pageviews: number of individual users who view a specific page (only one view is accounted for per session)
- Sessions: User interactions with your site in a given time frame
- Session duration: Average length of time on a specific site
- Pages per session: Average number of pages on your site that users access per session
- Bounce rate: Percentage of visitors that leave a webpage without taking action
4. Traffic Channels
Traffic channels are the avenues that traffic drives through to your website. Traffic channels are essential for understanding how visitors are finding and accessing your website. By tracking and analyzing different traffic channels, you can determine which sources are driving the most engaged and valuable traffic, enabling you to optimize your marketing efforts. Each traffic channel represents a distinct way users interact with your site, and the key performance indicators (KPIs) for these channels can reveal trends, behaviors, and opportunities for improvement.
Here is a list of common traffic channel KPIs:
- Organic search: Traffic from search engines
- Direct: Typed-in, bookmarked, or non-browser traffic
- Referral: Traffic from other websites
- Social: Traffic from social media channels
- Email: Traffic from emails
- Paid search: Traffic from paid search ads on search engines
- Display: Traffic from another website that ran your ad
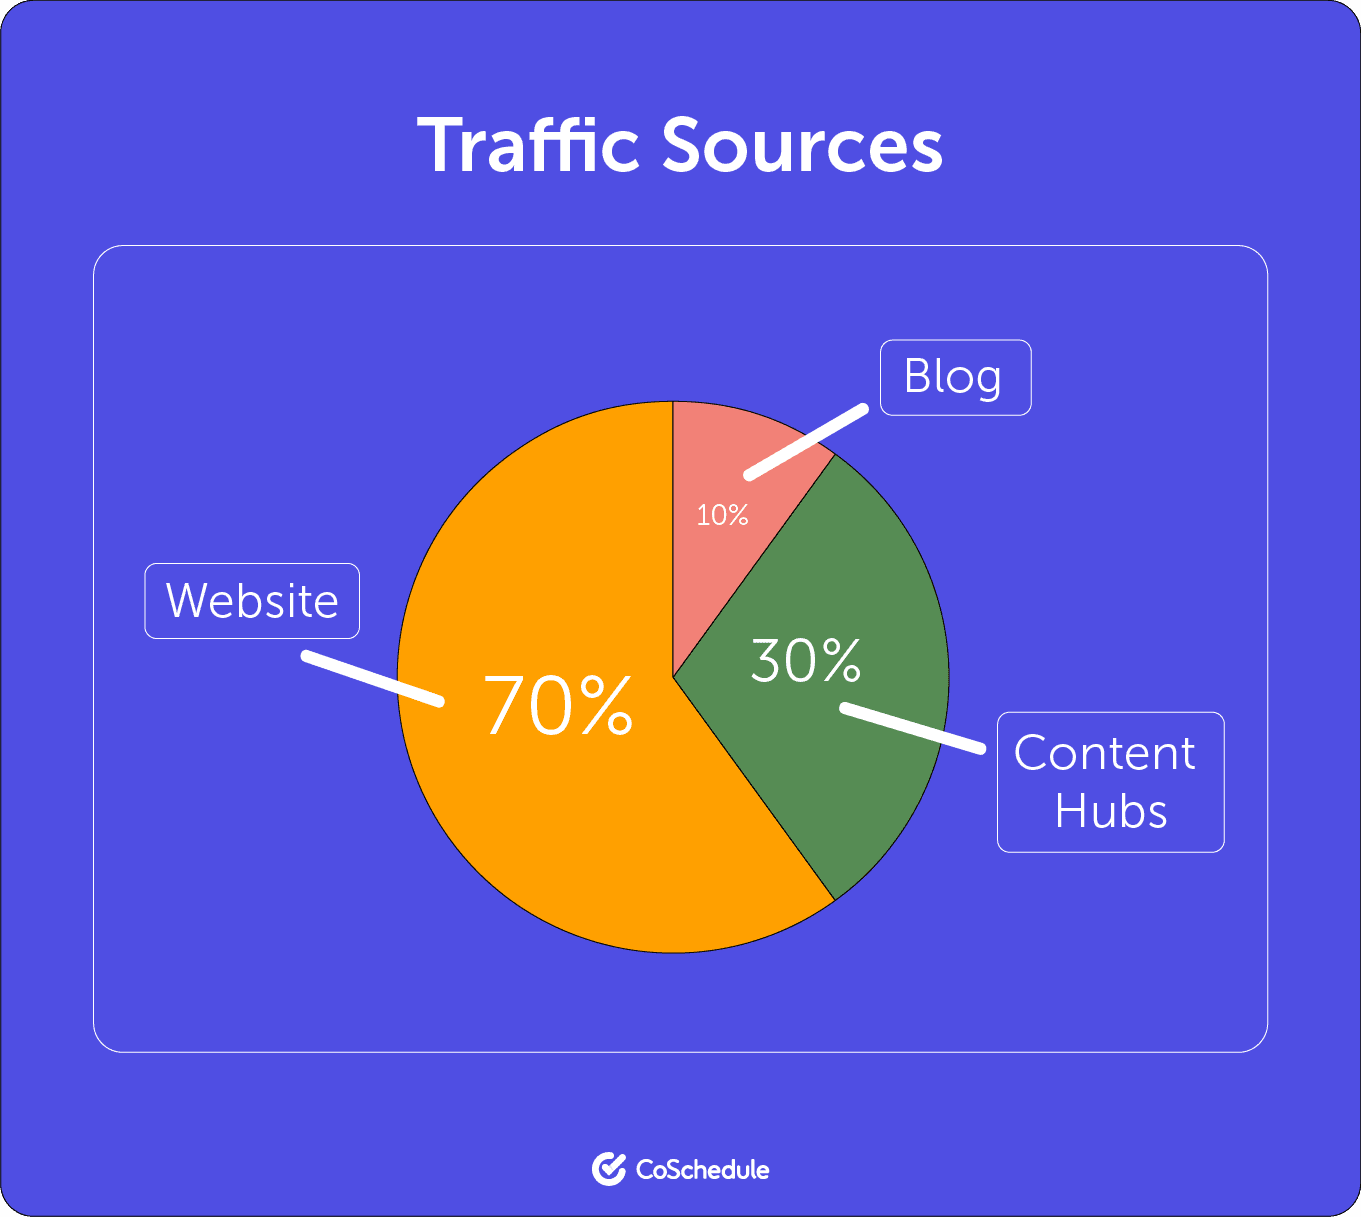
5. Traffic Sources
Tracking traffic sources helps you understand where your audience is coming from and how different channels contribute to your website’s performance. By identifying the websites, blogs, social platforms, or email campaigns driving users to your site, you can refine your marketing strategies and focus on the most valuable sources. Tools like Google Analytics provide detailed reports on various traffic sources, including organic search, direct visits, referral traffic, and paid ads.
With tools like Google Analytics, SEMrush, and social media insights, marketers can gain a view of how traffic is arriving at their site. Using UTM parameters for campaign tracking, filtering out spam, and analyzing social traffic can give deeper insights into how users engage across platforms. By focusing on key traffic sources and overcoming these challenges, marketers can optimize their content and spend more effectively.
Key Traffic Sources to Track:
- Organic search
- Direct visits
- Referral traffic (from other websites or blogs)
- Social media (Facebook, Instagram, LinkedIn, Twitter, etc.)
- Email campaigns
- Paid search (Google Ads, Bing Ads)
- Display advertising (banner or display network ads)
6. Engagements & Conversions
Digital engagements show the total number of interactions viewers have with your digital sites. These engagements lead to conversions from page viewers to paying customers.
Engagement metrics are the first taste of consumer interest, whereas conversions are consumers taking a full bite into the company.
Use these digital marketing KPIs to drive the long-term growth of your company.
- Video watches: Amount of interactions with video on a site
- Content shares: Number of shares for a content piece
- Content upgrades: Amount of downloadable email opt-in upgrades
- Email subscribers: Total number of email subscriber
- Marketing qualified leads (MQLs): Number of leads who indicated an interest based on trial starts, freemium product signups, etc.
- Sales qualified leads (SQLs): Number of potential customers based on discovery calls, demo calls, etc.
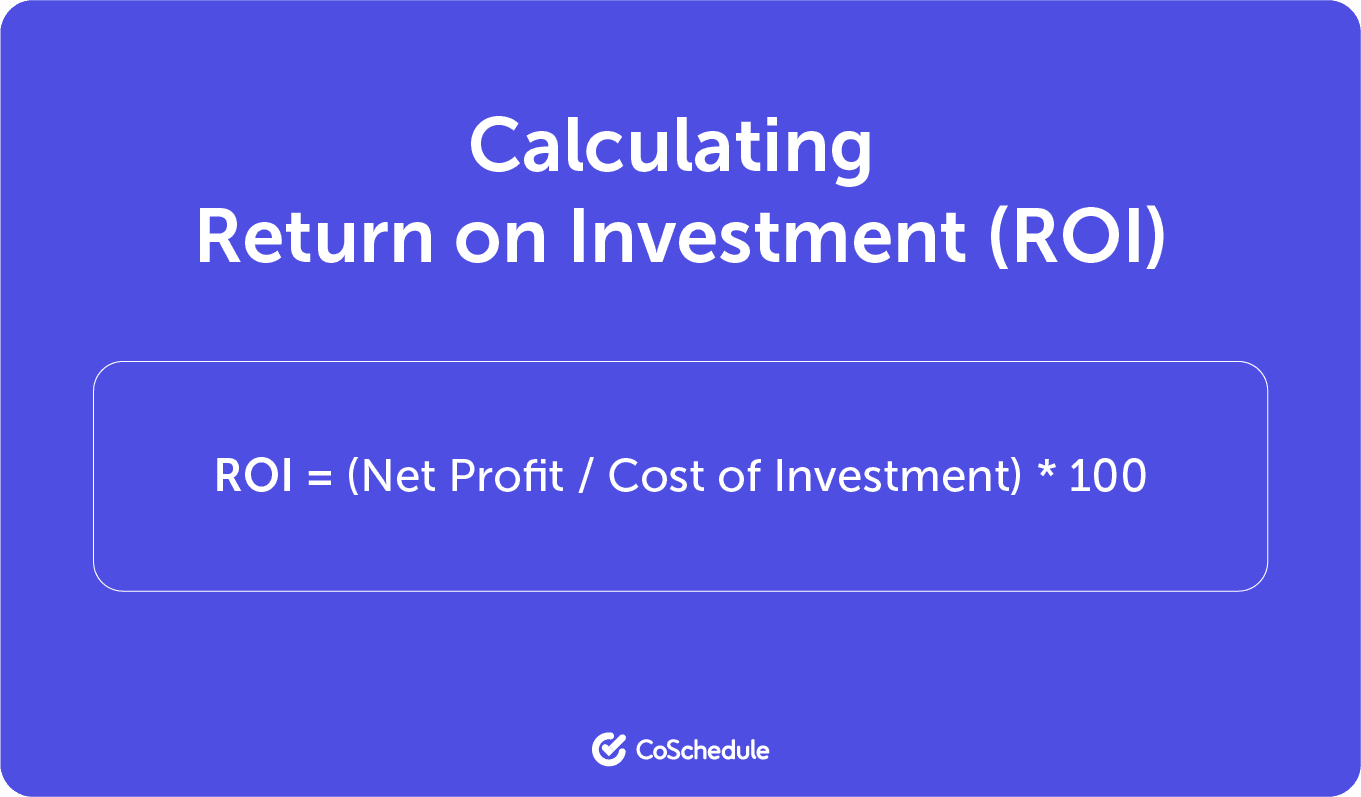
7. Return On Investment (ROI)
Evaluate how well an investment has performed through ROI. Digital marketing ROI metrics determine the success of your campaigns.
Return On Investment is calculated as a percentage: ROI = (Net Profit / Cost of Investment) * 100
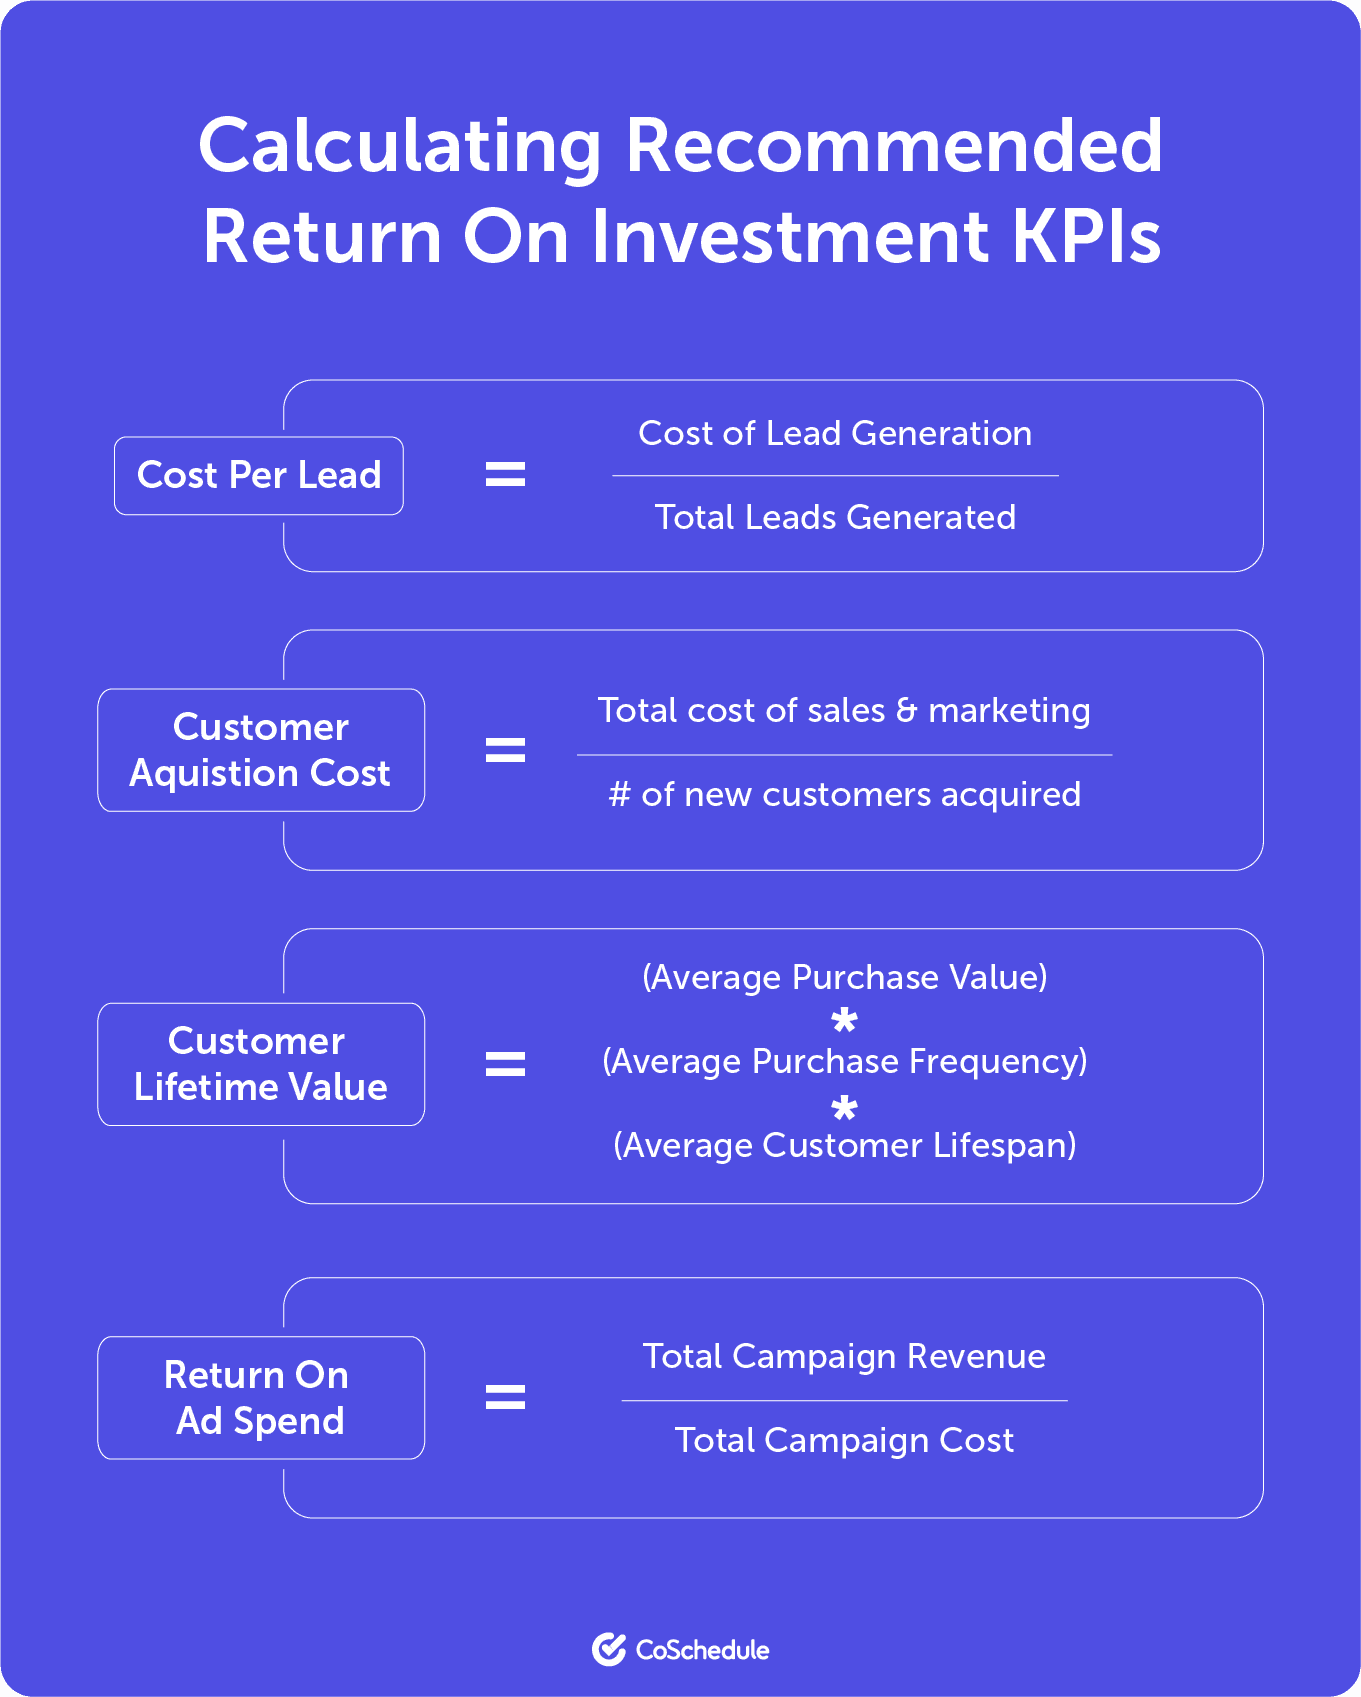
For marketing campaign success, track these Return On Investment KPIs:
- Cost Per Lead = Cost of Lead Generation / Total Leads Generated
- Customer Acquisition Cost (CAC) = Total cost of sales & marketing / # of new customers acquired
- Customer Lifetime Value (CLV) = Average Purchase Value * Average Purchase Frequency * Average Customer Lifespan
- Return On Ad Spend (ROAS) = Total Campaign Revenue / Total Campaign Cost
Tracking metrics is important, but so is staying organized. Learn how a Digital Marketing Agency Content Calendar can keep your strategy on track!
Understand the key digital marketing metrics that drive success. Get a head start on your client proposals with our RFP template.
8. Exit Rate
Exit rate is a critical metric that tracks the percentage of visitors who leave your website from a specific page, regardless of whether it’s their first page or a page they visited during their session. It helps identify where users are dropping off, which can indicate issues in user experience, content, or the conversion process.
By monitoring exit rates across your site, you can pinpoint areas that need improvement and optimize the user journey to increase engagement and conversions.
Track digital marketing exit rate through these KPIs:
- Page-specific exit rate: The percentage of visitors who leave after viewing a particular page (e.g., landing page, product page, or blog post).
- Overall exit rate: The total percentage of visitors leaving the website, useful for understanding the general flow of traffic.
- Exit rate by traffic source: This shows which sources (organic, paid, social, etc.) are driving visitors to pages with high exit rates.
- Exit rate by device type: Determines if mobile users, for example, are exiting more frequently than desktop users.
Why Exit Rate Matters
Exit rate helps you uncover the last interaction a user had before leaving the site. High exit rates on certain pages could signal issues with content, load times, or design, prompting you to reassess your site’s structure or messaging. For instance:
- High exit rate on a product page could mean the page isn’t engaging enough or that the call to action (CTA) isn’t clear.
- High exit rate on a checkout page might signal friction in the purchasing process.
How It Helps You Adjust Your Strategy:
- Identify pages with high exit rates: This allows you to refine them—whether it’s improving content quality, adding clearer CTAs, or making the navigation smoother.
- Assess the user experience: If visitors are leaving right after visiting a specific page, it could point to an issue with your site’s usability or value proposition.
- Content effectiveness: Exit rates also help evaluate whether your content is meeting user expectations. If people are bouncing off blog posts or landing pages, you might need to revise your messaging to keep them interested.
Regular Tracking and Actionable Insights:
Tracking exit rates regularly helps you stay proactive in identifying areas where users lose interest or get frustrated. This allows for quick adjustments to retain more visitors, increase engagement, and ultimately drive more conversions.
